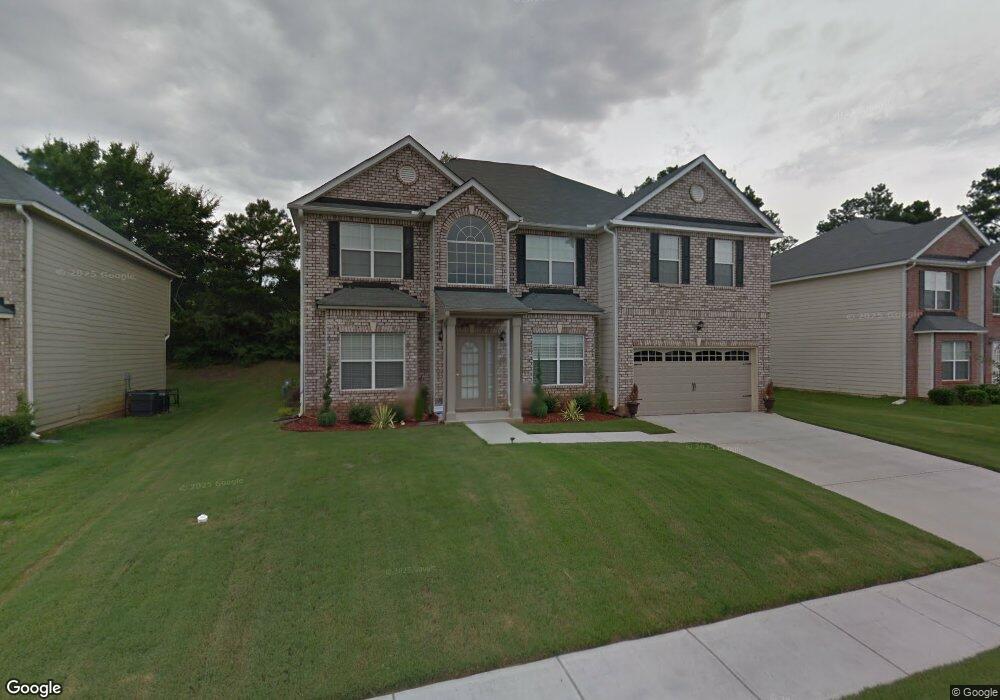
1522 Evergreen Hollow Ln Unit 7 Conyers, GA 30012
Estimated Value: $384,352 - $472,000
6
Beds
3
Baths
3,742
Sq Ft
$110/Sq Ft
Est. Value
About This Home
This home is located at 1522 Evergreen Hollow Ln Unit 7, Conyers, GA 30012 and is currently estimated at $411,088, approximately $109 per square foot. 1522 Evergreen Hollow Ln Unit 7 is a home located in Rockdale County with nearby schools including Pine Street Elementary School, Edwards Middle School, and Rockdale County High School.
Ownership History
Date
Name
Owned For
Owner Type
Purchase Details
Closed on
Feb 20, 2017
Sold by
Murray Cleon K
Bought by
Hinds Kesha J
Current Estimated Value
Purchase Details
Closed on
Jun 29, 2012
Sold by
Federal National Mortgage Association
Bought by
Hinds Kesha J and Murray Cleon K
Home Financials for this Owner
Home Financials are based on the most recent Mortgage that was taken out on this home.
Original Mortgage
$129,973
Interest Rate
3.76%
Mortgage Type
New Conventional
Purchase Details
Closed on
May 3, 2011
Sold by
Bank Of America
Bought by
Federal Natl Mtg Assn Fnma
Purchase Details
Closed on
Jan 31, 2008
Sold by
Legacy Cmntys Of Travers Creek
Bought by
Hudson Kiana F and Scott Marcus
Home Financials for this Owner
Home Financials are based on the most recent Mortgage that was taken out on this home.
Original Mortgage
$42,368
Interest Rate
6.06%
Mortgage Type
New Conventional
Create a Home Valuation Report for This Property
The Home Valuation Report is an in-depth analysis detailing your home's value as well as a comparison with similar homes in the area
Home Values in the Area
Average Home Value in this Area
Purchase History
| Date | Buyer | Sale Price | Title Company |
|---|---|---|---|
| Hinds Kesha J | -- | -- | |
| Hinds Kesha J | $129,000 | -- | |
| Federal Natl Mtg Assn Fnma | $99,000 | -- | |
| Bank Of America | $99,000 | -- | |
| Hudson Kiana F | $211,900 | -- |
Source: Public Records
Mortgage History
| Date | Status | Borrower | Loan Amount |
|---|---|---|---|
| Previous Owner | Hinds Kesha J | $129,973 | |
| Previous Owner | Hudson Kiana F | $42,368 |
Source: Public Records
Tax History Compared to Growth
Tax History
| Year | Tax Paid | Tax Assessment Tax Assessment Total Assessment is a certain percentage of the fair market value that is determined by local assessors to be the total taxable value of land and additions on the property. | Land | Improvement |
|---|---|---|---|---|
| 2024 | $7,416 | $188,360 | $33,440 | $154,920 |
| 2023 | $4,993 | $130,200 | $23,520 | $106,680 |
| 2022 | $4,780 | $124,120 | $23,520 | $100,600 |
| 2021 | $3,628 | $91,200 | $17,120 | $74,080 |
| 2020 | $3,851 | $91,200 | $17,120 | $74,080 |
| 2019 | $2,995 | $71,680 | $9,320 | $62,360 |
| 2018 | $1,755 | $71,680 | $9,320 | $62,360 |
| 2017 | $2,556 | $65,120 | $9,320 | $55,800 |
| 2016 | $2,453 | $65,120 | $9,320 | $55,800 |
| 2015 | $1,454 | $65,120 | $9,320 | $55,800 |
| 2014 | $1,064 | $56,000 | $7,200 | $48,800 |
| 2013 | -- | $69,280 | $14,000 | $55,280 |
Source: Public Records
Map
Nearby Homes
- 1400 Travers Creek Trail
- 1546 Evergreen Hollow Ln
- 2265 Rockbridge Rd NW
- 2476 Rockbridge Rd NW
- 2476 Rockbridge Rd NW Unit LOT 18
- 2468 Rockbridge Rd NW
- 1463 River Stone Trace
- 1740 Millstream Hollow
- 1152 Stepping Stone Ln
- 1586 Larkspur Trail
- 1650 Larkspur Trail
- 1890 Millstream Hollow
- 1151 Pinedale Cir NW
- 1223 Cedar Creek Ct NW
- 2039 Wildflower Way NW
- 1611 Wesley Way NW
- 1432 Forest Villa Dr NW
- 995 Sigman Rd NW
- 1547 Mountain View Cir NW
- 1791 Crestridge Cir NW
- 1522 Evergreen Hollow Ln
- 1518 Evergreen Hollow Ln
- 1526 Evergreen Hollow Ln
- 1514 Evergreen Hollow Ln
- 1609 Blue Spruce Ln
- 1513 Evergreen Hollow Ln
- 1505 Evergreen Hollow Ln
- 1765 Rockbridge Rd NW
- 1509 Evergreen Hollow Ln
- 1510 Evergreen Hollow Ln
- 1775 Rockbridge Rd NW
- 1530 Evergreen Hollow Ln
- 1534 Evergreen Hollow Ln Unit 10
- 1534 Evergreen Hollow Ln
- 1610 Blue Spruce Ln
- 1605 Blue Spruce Ln
- 1785 Rockbridge Rd NW
- 1745 Rockbridge Rd NW
- 1506 Evergreen Hollow Ln
- 1606 Blue Spruce Ln