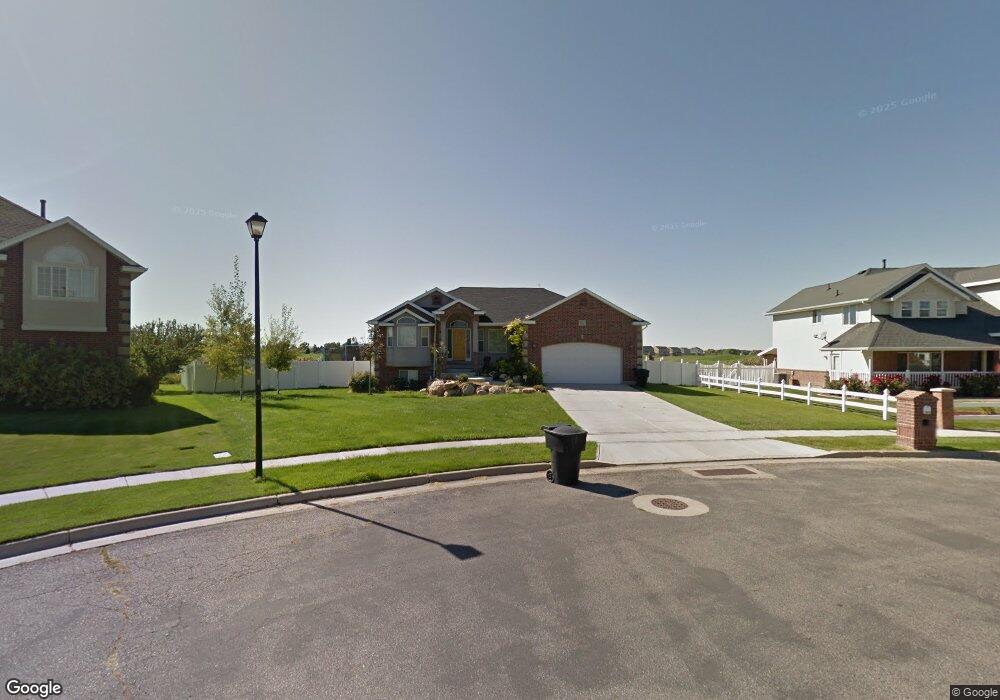
1522 Gleneagles Dr Syracuse, UT 84075
Estimated Value: $621,000 - $672,000
5
Beds
3
Baths
3,392
Sq Ft
$192/Sq Ft
Est. Value
About This Home
This home is located at 1522 Gleneagles Dr, Syracuse, UT 84075 and is currently estimated at $651,325, approximately $192 per square foot. 1522 Gleneagles Dr is a home located in Davis County with nearby schools including Buffalo Point School, Syracuse Junior High School, and Syracuse High School.
Ownership History
Date
Name
Owned For
Owner Type
Purchase Details
Closed on
Jul 3, 2013
Sold by
Kennington Jeff and Kennington Peggy
Bought by
Wilcox Andrew and Wilcox Amy
Current Estimated Value
Home Financials for this Owner
Home Financials are based on the most recent Mortgage that was taken out on this home.
Original Mortgage
$218,500
Outstanding Balance
$155,981
Interest Rate
3.57%
Mortgage Type
New Conventional
Estimated Equity
$495,344
Purchase Details
Closed on
Jan 23, 2007
Sold by
Kennington Jeff
Bought by
Kennington Jeff and Kennington Peggy
Home Financials for this Owner
Home Financials are based on the most recent Mortgage that was taken out on this home.
Original Mortgage
$250,400
Interest Rate
7.87%
Mortgage Type
New Conventional
Purchase Details
Closed on
Aug 16, 2006
Sold by
Stone Michele L
Bought by
Kennington Jeff
Home Financials for this Owner
Home Financials are based on the most recent Mortgage that was taken out on this home.
Original Mortgage
$244,710
Interest Rate
8.5%
Mortgage Type
Purchase Money Mortgage
Purchase Details
Closed on
Aug 2, 2005
Sold by
Stone Michele L
Bought by
Stone Michele L and Michele L Stone Living Trust
Home Financials for this Owner
Home Financials are based on the most recent Mortgage that was taken out on this home.
Original Mortgage
$44,500
Interest Rate
5.46%
Mortgage Type
New Conventional
Purchase Details
Closed on
Jan 4, 2005
Sold by
Fries Brandon
Bought by
Stone Michele L and Michele L Stone Living Trust
Purchase Details
Closed on
Jun 18, 2003
Sold by
Foley Lisa Clay
Bought by
Fries Brandon
Purchase Details
Closed on
Jun 12, 2001
Sold by
Fries Brandon
Bought by
Fries Brandon and Fries Jeff
Home Financials for this Owner
Home Financials are based on the most recent Mortgage that was taken out on this home.
Original Mortgage
$212,000
Interest Rate
7.14%
Mortgage Type
Balloon
Purchase Details
Closed on
Apr 27, 2001
Sold by
T Con Ltd Partnership
Bought by
Fries Brandon
Home Financials for this Owner
Home Financials are based on the most recent Mortgage that was taken out on this home.
Original Mortgage
$212,000
Interest Rate
7.14%
Mortgage Type
Balloon
Purchase Details
Closed on
Nov 22, 2000
Sold by
T Con Ltd Partnership
Bought by
T Con Ltd Partnership and T Con Homes
Home Financials for this Owner
Home Financials are based on the most recent Mortgage that was taken out on this home.
Original Mortgage
$26,000
Interest Rate
7.86%
Mortgage Type
Seller Take Back
Create a Home Valuation Report for This Property
The Home Valuation Report is an in-depth analysis detailing your home's value as well as a comparison with similar homes in the area
Home Values in the Area
Average Home Value in this Area
Purchase History
| Date | Buyer | Sale Price | Title Company |
|---|---|---|---|
| Wilcox Andrew | -- | Inwest Title Services | |
| Kennington Jeff | -- | Equity Title Ins Agency Inc | |
| Kennington Jeff | -- | Heritage West Title Ins Agen | |
| Stone Michele L | -- | Heritage West Title Ins Agen | |
| Stone Michele L | -- | Heritage West Title Ins Agen | |
| Stone Michele L | -- | None Available | |
| Fries Brandon | -- | Backman Stewart Title Servic | |
| Fries Brandon | -- | Bonneville Title Company Inc | |
| Fries Brandon | -- | Bonneville Title Company Inc | |
| T Con Ltd Partnership | -- | -- | |
| Brandon Fries & T Con Homes Lp | -- | Backman Stewart Title | |
| Fries Brandon | -- | Backman Stewart Title Servic |
Source: Public Records
Mortgage History
| Date | Status | Borrower | Loan Amount |
|---|---|---|---|
| Open | Wilcox Andrew | $218,500 | |
| Previous Owner | Kennington Jeff | $250,400 | |
| Previous Owner | Kennington Jeff | $244,710 | |
| Previous Owner | Stone Michele L | $44,500 | |
| Previous Owner | Fries Brandon | $212,000 | |
| Previous Owner | Fries Brandon | $26,000 |
Source: Public Records
Tax History Compared to Growth
Tax History
| Year | Tax Paid | Tax Assessment Tax Assessment Total Assessment is a certain percentage of the fair market value that is determined by local assessors to be the total taxable value of land and additions on the property. | Land | Improvement |
|---|---|---|---|---|
| 2025 | $3,403 | $328,350 | $117,085 | $211,265 |
| 2024 | $3,261 | $316,800 | $100,016 | $216,784 |
| 2023 | $3,158 | $559,000 | $144,482 | $414,518 |
| 2022 | $3,378 | $327,800 | $76,113 | $251,687 |
| 2021 | $2,923 | $439,000 | $110,492 | $328,508 |
| 2020 | $2,599 | $378,000 | $93,339 | $284,661 |
| 2019 | $2,501 | $359,000 | $94,889 | $264,111 |
| 2018 | $2,365 | $337,000 | $90,954 | $246,046 |
| 2016 | $2,068 | $154,550 | $36,133 | $118,417 |
| 2015 | $2,117 | $150,700 | $36,133 | $114,567 |
| 2014 | $1,807 | $131,026 | $36,133 | $94,893 |
| 2013 | -- | $134,750 | $34,033 | $100,717 |
Source: Public Records
Map
Nearby Homes
- 1441 Brookshire Dr
- 2982 S 3000 W
- 2912 S 3000 W
- 2840 W 1200 S
- 2679 W Antelope Dr
- 3627 W Augusta Dr
- 3564 Princeville Dr
- 3579 W 1775 S
- 3736 W 1225 S
- 1641 S 2350 W Unit B
- 2655 S 2430 W Unit 120
- 2665 S 2430 W Unit 118
- 2655 S 2430 W Unit 116
- 2633 S 2430 W Unit 113
- 2614 S 2430 W Unit 106
- 2663 S 2430 W
- 4344 W 1825 S Unit 102
- 4354 W 1825 S Unit 104
- 4348 W 1825 S Unit 103
- 851 S 3525 W
- 3045 Gleneagles Dr
- 1508 S 3050 W
- 1508 Gleneagles Dr
- 1509 Gleneagles Dr
- 3033 Gleneagles Dr
- 1486 Gleneagles Dr
- 1487 Gleneagles Dr
- 1487 Gleneagles Dr Unit 9
- 3016 Gleneagles Dr
- 3015 Gleneagles Dr
- 1470 Gleneagles Dr
- 1492 S 3000 W
- 1492 Gleneagles Dr
- 986 W 1525 S Unit 115
- 994 W 1525 S Unit 116
- 962 W 1525 S Unit 112
- 962 W 1525 S
- 971 W 1525 S Unit 108
- 979 W 1525 S Unit 107
- 978 W 1525 S Unit 114