Estimated Value: $548,000 - $931,000
2
Beds
1
Bath
1,300
Sq Ft
$518/Sq Ft
Est. Value
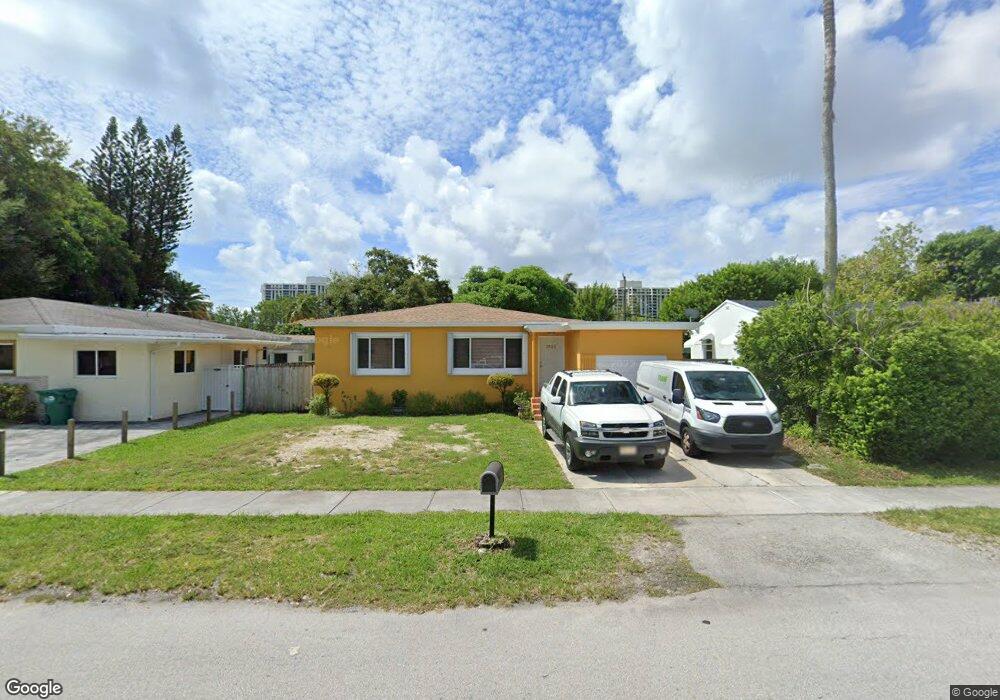
About This Home
2BED 2 BATH PLUS DEN TOWNHOUSE
GARAGE INCLUDED (TWO CARS)
500$ DEPOSIT
Ownership History
Date
Name
Owned For
Owner Type
Purchase Details
Closed on
Jun 16, 2011
Sold by
Brigham Gladys and Brigham Harry
Bought by
Cabrera Manuel
Current Estimated Value
Home Financials for this Owner
Home Financials are based on the most recent Mortgage that was taken out on this home.
Original Mortgage
$121,806
Outstanding Balance
$83,456
Interest Rate
4.5%
Mortgage Type
FHA
Estimated Equity
$589,310
Purchase Details
Closed on
May 15, 2008
Sold by
Caicedo Sebastian and Bird Katherine
Bought by
Brigham Gladys
Purchase Details
Closed on
Mar 3, 1999
Sold by
Richam Properties Inc
Bought by
Abraham Jesemie
Home Financials for this Owner
Home Financials are based on the most recent Mortgage that was taken out on this home.
Original Mortgage
$79,652
Interest Rate
6.79%
Mortgage Type
FHA
Purchase Details
Closed on
Dec 7, 1998
Sold by
Price Rose
Bought by
Richman Properties Inc
Create a Home Valuation Report for This Property
The Home Valuation Report is an in-depth analysis detailing your home's value as well as a comparison with similar homes in the area
Home Values in the Area
Average Home Value in this Area
Purchase History
| Date | Buyer | Sale Price | Title Company |
|---|---|---|---|
| Cabrera Manuel | $125,000 | Cambridge Title & Closing Se | |
| Brigham Gladys | $125,000 | Attorney | |
| Abraham Jesemie | $82,900 | -- | |
| Richman Properties Inc | $40,000 | -- |
Source: Public Records
Mortgage History
| Date | Status | Borrower | Loan Amount |
|---|---|---|---|
| Open | Cabrera Manuel | $121,806 | |
| Previous Owner | Richman Properties Inc | $79,652 |
Source: Public Records
Property History
| Date | Event | Price | List to Sale | Price per Sq Ft |
|---|---|---|---|---|
| 11/29/2024 11/29/24 | Off Market | $4,149 | -- | -- |
| 10/08/2024 10/08/24 | Off Market | $4,149 | -- | -- |
| 09/27/2024 09/27/24 | For Rent | $4,149 | 0.0% | -- |
| 04/25/2024 04/25/24 | For Rent | $4,149 | -- | -- |
Tax History Compared to Growth
Tax History
| Year | Tax Paid | Tax Assessment Tax Assessment Total Assessment is a certain percentage of the fair market value that is determined by local assessors to be the total taxable value of land and additions on the property. | Land | Improvement |
|---|---|---|---|---|
| 2025 | $5,782 | $210,427 | -- | -- |
| 2024 | $5,508 | $191,298 | -- | -- |
| 2023 | $5,508 | $173,908 | $0 | $0 |
| 2022 | $4,757 | $158,099 | $0 | $0 |
| 2021 | $5,367 | $143,727 | $0 | $0 |
| 2020 | $3,735 | $257,725 | $186,714 | $71,011 |
| 2019 | $3,332 | $217,699 | $138,494 | $79,205 |
| 2018 | $3,175 | $228,124 | $148,919 | $79,205 |
| 2017 | $2,963 | $98,169 | $0 | $0 |
| 2016 | $2,714 | $89,245 | $0 | $0 |
| 2015 | $2,552 | $81,132 | $0 | $0 |
| 2014 | -- | $73,757 | $0 | $0 |
Source: Public Records
Map
Nearby Homes
- 10900 N Bayshore Dr
- 1540 NE Quayside Terrace Unit D1
- 1530 NE Quayside Terrace Unit A1
- 1558 NE Quayside Terrace Unit D10
- 1371 NE 110th Terrace
- 10875 N Bayshore Dr
- 1000 Quayside Te Unit 410
- 1000 Quayside Te Unit 509
- 1000 NE Quayside Terrace Unit 804
- 1000 Quayside Terrace Unit PH9
- 1000 Quayside Terrace Unit 505
- 1000 Quayside Terrace Unit 905
- 1000 Quayside Terrace Unit 508
- 1000 Quayside Terrace Unit 706
- 1000 Quayside Terrace Unit 308
- 1000 Quayside Terrace Unit 1606
- 1000 Quayside Terrace Unit TS-11
- 1000 Quayside Terrace Unit 411
- 1000 Quayside Terrace Unit 1009
- 1000 Quayside Terrace Unit 1107
- 1532 NE 110th Terrace Unit 1352
- 1532 NE 110th Terrace
- 1533 NE 110th Terrace Unit 1533
- 1510 NE 110th Terrace
- 1530 NE 110th Terrace
- 1525 NE 110th Terrace
- 1500 NE 110th Terrace
- 1540 NE 110th Terrace
- 1515 NE 110th St
- 1521 NE 110th St
- 1521 NE 110th St Unit 1521
- 1521 NE 110th St
- 1565 NE 110th Terrace
- 1561 NE 110th St
- 1521 NE 110th St Unit 1561
- 1511 NE 110th St
- 1490 NE 110th Terrace
- 1537 NE 110th St
- 1523 NE 110th Terrace Unit 1523
- 1523 NE 110th Terrace