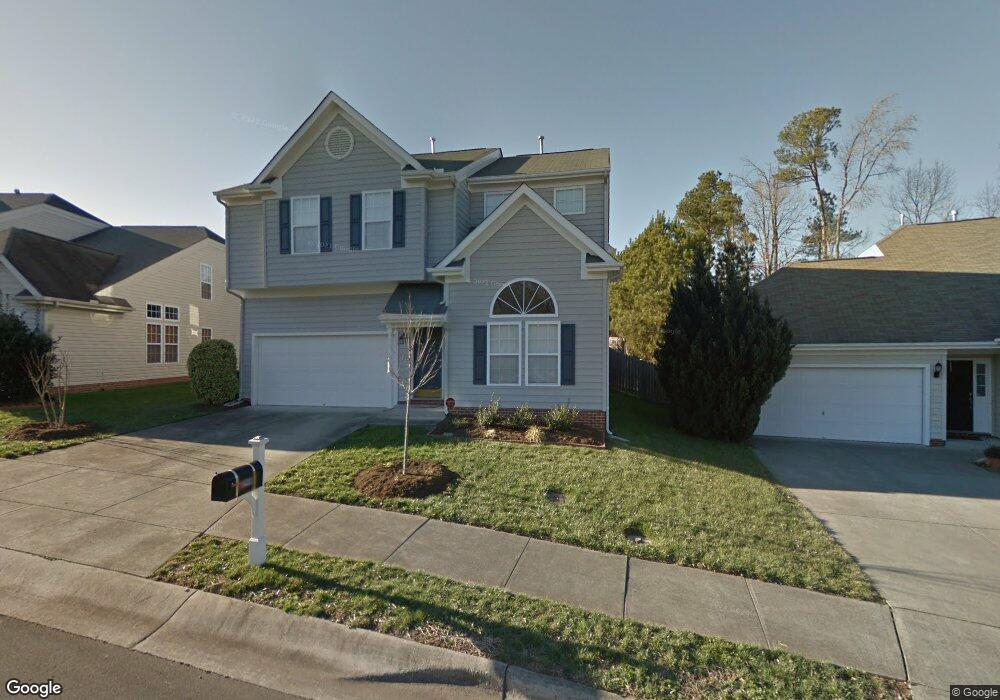
1522 Pebble Creek Crossing Durham, NC 27713
Woodcroft NeighborhoodEstimated Value: $457,000 - $507,000
4
Beds
3
Baths
2,230
Sq Ft
$216/Sq Ft
Est. Value
About This Home
This home is located at 1522 Pebble Creek Crossing, Durham, NC 27713 and is currently estimated at $481,206, approximately $215 per square foot. 1522 Pebble Creek Crossing is a home located in Durham County with nearby schools including Pearsontown Elementary School, Lowe's Grove Middle, and Hillside High School.
Ownership History
Date
Name
Owned For
Owner Type
Purchase Details
Closed on
Apr 28, 2005
Sold by
Powell Sean K and Powell Melody P
Bought by
Thacker Samuel Shane and Schmid Lorrie A
Current Estimated Value
Home Financials for this Owner
Home Financials are based on the most recent Mortgage that was taken out on this home.
Original Mortgage
$163,920
Outstanding Balance
$85,688
Interest Rate
5.88%
Mortgage Type
Fannie Mae Freddie Mac
Estimated Equity
$395,518
Purchase Details
Closed on
Oct 19, 2001
Sold by
Terry Peterson Residential Twenty Llc
Bought by
Powell Sean K
Home Financials for this Owner
Home Financials are based on the most recent Mortgage that was taken out on this home.
Original Mortgage
$163,800
Interest Rate
6%
Create a Home Valuation Report for This Property
The Home Valuation Report is an in-depth analysis detailing your home's value as well as a comparison with similar homes in the area
Home Values in the Area
Average Home Value in this Area
Purchase History
| Date | Buyer | Sale Price | Title Company |
|---|---|---|---|
| Thacker Samuel Shane | $205,000 | -- | |
| Powell Sean K | $205,000 | -- |
Source: Public Records
Mortgage History
| Date | Status | Borrower | Loan Amount |
|---|---|---|---|
| Open | Thacker Samuel Shane | $163,920 | |
| Previous Owner | Powell Sean K | $163,800 | |
| Closed | Powell Sean K | $30,711 | |
| Closed | Thacker Samuel Shane | $20,490 |
Source: Public Records
Tax History Compared to Growth
Tax History
| Year | Tax Paid | Tax Assessment Tax Assessment Total Assessment is a certain percentage of the fair market value that is determined by local assessors to be the total taxable value of land and additions on the property. | Land | Improvement |
|---|---|---|---|---|
| 2025 | $3,587 | $490,431 | $124,950 | $365,481 |
| 2024 | $3,587 | $257,151 | $53,415 | $203,736 |
| 2023 | $3,368 | $257,151 | $53,415 | $203,736 |
| 2022 | $3,291 | $257,151 | $53,415 | $203,736 |
| 2021 | $3,276 | $257,151 | $53,415 | $203,736 |
| 2020 | $3,199 | $257,151 | $53,415 | $203,736 |
| 2019 | $3,199 | $257,151 | $53,415 | $203,736 |
| 2018 | $3,144 | $231,805 | $48,577 | $183,228 |
| 2017 | $3,121 | $231,805 | $48,577 | $183,228 |
| 2016 | $3,016 | $231,805 | $48,577 | $183,228 |
| 2015 | $3,234 | $233,592 | $43,034 | $190,558 |
| 2014 | $3,234 | $233,592 | $43,034 | $190,558 |
Source: Public Records
Map
Nearby Homes
- 1308 Snyder St
- 3 Chownings St
- 1 Chownings St
- 3 Newgate Ct
- 1304 Copper Creek Dr
- 1001 Pebble Creek Crossing Unit 12
- 1017 Red Hat Ln
- 1003 Crimson Dr Unit 2
- 6502 Barbee Rd
- 1122 Vermillion Dr
- 5624 Barbee Rd
- 6304 Forest Ridge Dr
- 13 Byerly Ct
- 5808 Sandstone Dr
- 1022 Carpenter Fletcher Rd
- 1045 Flagler St
- 1062 Flagler St
- 909 Windcrest Rd
- 5708 Catskill Ct
- 5700 Barbee Rd
- 1524 Pebble Creek Crossing
- 1520 Pebble Creek Crossing
- 1310 Auburn Village Dr
- 1312 Auburn Village Dr
- 1518 Pebble Creek Crossing
- 1308 Auburn Village Dr
- 1526 Pebble Creek Crossing
- 1314 Auburn Village Dr
- 1516 Pebble Creek Crossing
- 1519 Pebble Creek Crossing
- 1306 Auburn Village Dr
- 1523 Pebble Creek Crossing
- 1528 Pebble Creek Crossing
- 1525 Pebble Creek Crossing
- 1514 Pebble Creek Crossing
- 1304 Auburn Village Dr
- 1530 Pebble Creek Crossing
- 1515 Pebble Creek Crossing
- 1527 Pebble Creek Crossing
- 16 Chowings St