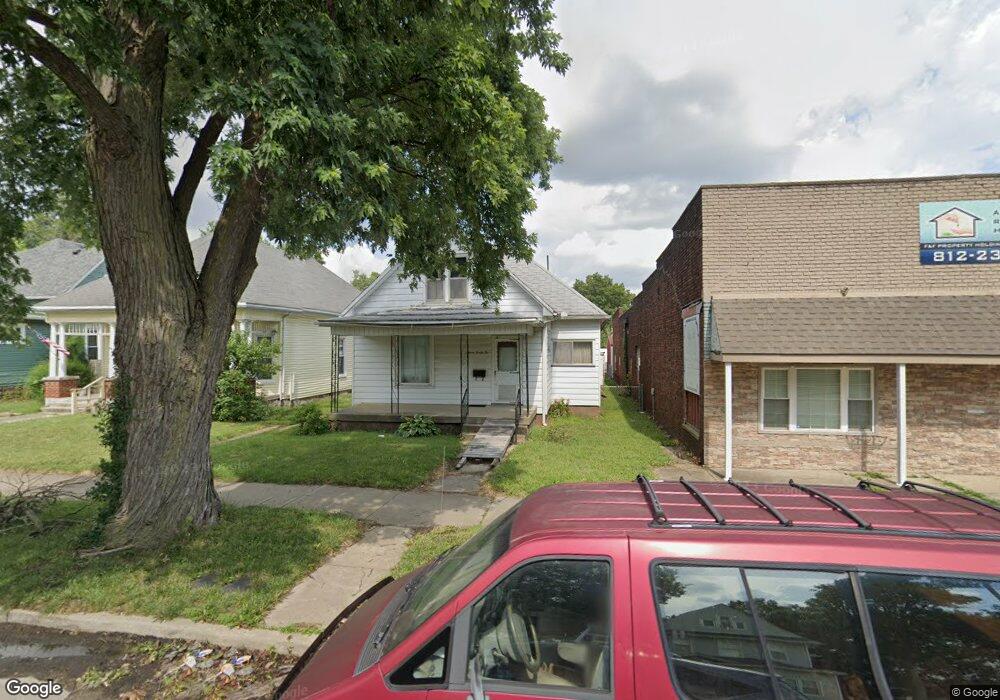
1522 S 7th St Terre Haute, IN 47802
South 13th Street NeighborhoodEstimated Value: $114,000 - $157,000
3
Beds
2
Baths
3,684
Sq Ft
$36/Sq Ft
Est. Value
About This Home
This home is located at 1522 S 7th St, Terre Haute, IN 47802 and is currently estimated at $131,973, approximately $35 per square foot. 1522 S 7th St is a home located in Vigo County with nearby schools including Farrington Grove Elementary School, Sarah Scott Middle School, and Terre Haute South Vigo High School.
Ownership History
Date
Name
Owned For
Owner Type
Purchase Details
Closed on
Dec 16, 2024
Sold by
Orndoff Harrold M
Bought by
House Dr Llc
Current Estimated Value
Purchase Details
Closed on
Sep 15, 2008
Sold by
Sullivan Johnny L and Sullivan Joe A
Bought by
Orndorff Harold M
Home Financials for this Owner
Home Financials are based on the most recent Mortgage that was taken out on this home.
Original Mortgage
$59,206
Interest Rate
6.55%
Mortgage Type
Unknown
Create a Home Valuation Report for This Property
The Home Valuation Report is an in-depth analysis detailing your home's value as well as a comparison with similar homes in the area
Home Values in the Area
Average Home Value in this Area
Purchase History
| Date | Buyer | Sale Price | Title Company |
|---|---|---|---|
| House Dr Llc | $49,000 | Aames Title & Closing Llc | |
| Orndorff Harold M | -- | -- |
Source: Public Records
Mortgage History
| Date | Status | Borrower | Loan Amount |
|---|---|---|---|
| Previous Owner | Orndorff Harold M | $59,206 |
Source: Public Records
Tax History Compared to Growth
Tax History
| Year | Tax Paid | Tax Assessment Tax Assessment Total Assessment is a certain percentage of the fair market value that is determined by local assessors to be the total taxable value of land and additions on the property. | Land | Improvement |
|---|---|---|---|---|
| 2024 | $978 | $93,200 | $9,200 | $84,000 |
| 2023 | $1,137 | $89,200 | $9,200 | $80,000 |
| 2022 | $1,013 | $82,200 | $9,200 | $73,000 |
| 2021 | $907 | $75,200 | $9,100 | $66,100 |
| 2020 | $910 | $74,500 | $8,900 | $65,600 |
| 2019 | $853 | $73,200 | $8,700 | $64,500 |
| 2018 | $1,178 | $70,500 | $8,400 | $62,100 |
| 2017 | $775 | $69,500 | $8,300 | $61,200 |
| 2016 | $563 | $61,600 | $8,300 | $53,300 |
| 2014 | $519 | $59,700 | $8,200 | $51,500 |
| 2013 | $519 | $58,500 | $8,100 | $50,400 |
Source: Public Records
Map
Nearby Homes