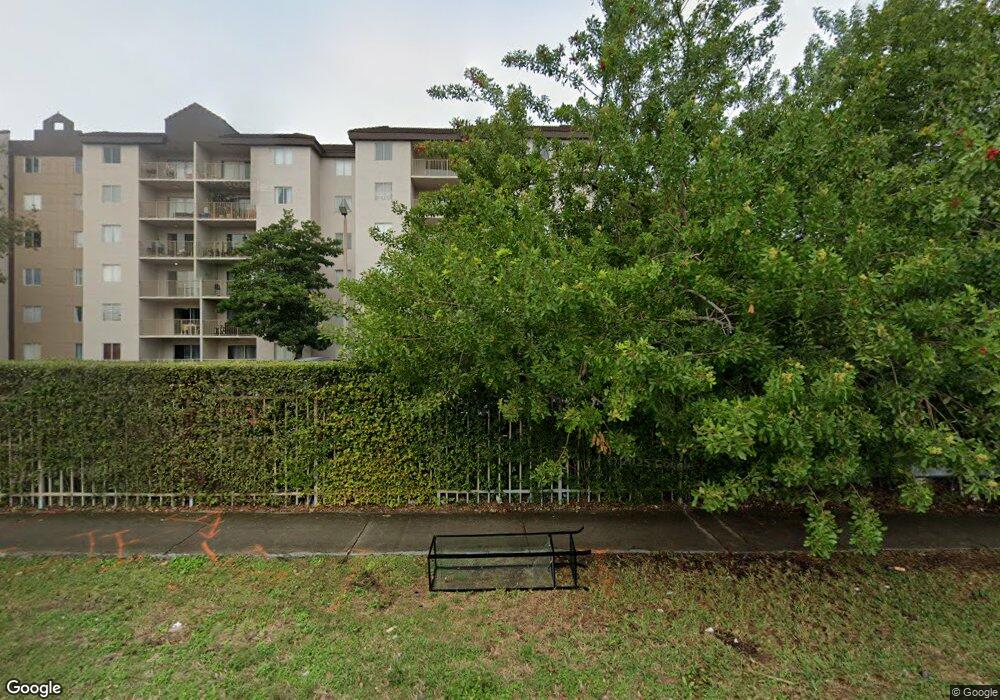
Kendall Lakes Towers 15221 SW 80th St Unit 401 Miami, FL 33193
Estimated Value: $268,719 - $338,000
3
Beds
2
Baths
987
Sq Ft
$303/Sq Ft
Est. Value
About This Home
This home is located at 15221 SW 80th St Unit 401, Miami, FL 33193 and is currently estimated at $298,930, approximately $302 per square foot. 15221 SW 80th St Unit 401 is a home located in Miami-Dade County with nearby schools including Bowman Ashe/Doolin K-8 Academy, Lamar Louise Curry Middle School, and John A. Ferguson Senior High School.
Ownership History
Date
Name
Owned For
Owner Type
Purchase Details
Closed on
Feb 20, 2014
Sold by
Chuan Nivea Y
Bought by
Beroci Investment Corp
Current Estimated Value
Purchase Details
Closed on
Jan 31, 2011
Sold by
Fannie Mae
Bought by
Chuan Nivea Y
Purchase Details
Closed on
Sep 23, 2010
Sold by
Paniagua Nilda
Bought by
Federal National Mortgage Association
Purchase Details
Closed on
Jun 15, 2006
Sold by
Kendall Lake Group Llc
Bought by
Paniagua Francisco A and Paniagua Nilda
Home Financials for this Owner
Home Financials are based on the most recent Mortgage that was taken out on this home.
Original Mortgage
$177,300
Interest Rate
6.49%
Mortgage Type
Unknown
Create a Home Valuation Report for This Property
The Home Valuation Report is an in-depth analysis detailing your home's value as well as a comparison with similar homes in the area
Home Values in the Area
Average Home Value in this Area
Purchase History
| Date | Buyer | Sale Price | Title Company |
|---|---|---|---|
| Beroci Investment Corp | $127,000 | Attorney | |
| Chuan Nivea Y | $74,700 | Title & Abstract Agency Of A | |
| Federal National Mortgage Association | $48,100 | None Available | |
| Federal National Mortgage Association | $48,100 | None Available | |
| Paniagua Francisco A | $221,700 | Xpress Title |
Source: Public Records
Mortgage History
| Date | Status | Borrower | Loan Amount |
|---|---|---|---|
| Previous Owner | Paniagua Francisco A | $177,300 |
Source: Public Records
Tax History Compared to Growth
Tax History
| Year | Tax Paid | Tax Assessment Tax Assessment Total Assessment is a certain percentage of the fair market value that is determined by local assessors to be the total taxable value of land and additions on the property. | Land | Improvement |
|---|---|---|---|---|
| 2025 | $3,380 | $194,725 | -- | -- |
| 2024 | $2,878 | $177,023 | -- | -- |
| 2023 | $2,878 | $160,930 | $0 | $0 |
| 2022 | $2,525 | $146,300 | $0 | $0 |
| 2021 | $2,356 | $133,000 | $0 | $0 |
| 2020 | $2,363 | $133,000 | $0 | $0 |
| 2019 | $2,345 | $133,000 | $0 | $0 |
| 2018 | $2,065 | $118,781 | $0 | $0 |
| 2017 | $2,061 | $115,627 | $0 | $0 |
| 2016 | $1,895 | $105,116 | $0 | $0 |
| 2015 | $1,842 | $100,110 | $0 | $0 |
| 2014 | -- | $69,780 | $0 | $0 |
Source: Public Records
About Kendall Lakes Towers
Map
Nearby Homes
- 15241 SW 80th St Unit 207
- 15280 SW 80th St Unit 3
- 15231 SW 80th St Unit 503
- 15231 SW 80th St Unit 101
- 8000 SW 152nd Ave Unit 115
- 15201 SW 80th St Unit 207
- 15201 SW 80th St Unit 302
- 7655 SW 153rd Ct Unit 202
- 7611 SW 153rd Ct Unit 105
- 15355 SW 76th Terrace Unit 205
- 15124 SW 81st St Unit 102
- 8133 SW 152nd Ct
- 7666 SW 152nd Ave Unit 514
- 8109 SW 151st Ave Unit 313
- 7670 SW 152nd Ave Unit 1202
- 7670 SW 152nd Ave Unit 1201
- 15411 SW 81st Cir Ln Unit 34
- 15500 SW 80th St Unit A105
- 15480 SW 82nd Ln Unit 228
- 15520 SW 80th St Unit B301
- 15221 SW 80th St
- 15221 SW 80th St Unit 504
- 15221 SW 80th St Unit 507
- 15221 SW 80th St Unit 405
- 15221 SW 80th St Unit 312
- 15221 SW 80th St Unit 512
- 15221 SW 80th St Unit 502
- 15221 SW 80th St Unit 515
- 15221 SW 80th St Unit 112
- 15221 SW 80th St Unit 311
- 15221 SW 80th St Unit 608
- 15221 SW 80th St Unit 514
- 15221 SW 80th St
- 15221 SW 80th St
- 15221 SW 80th St Unit 306
- 15221 SW 80th St Unit 604
- 15221 SW 80th St Unit 401
- 15221 SW 80th St Unit 207
- 15221 SW 80th St Unit 608
- 15221 SW 80th St Unit 511