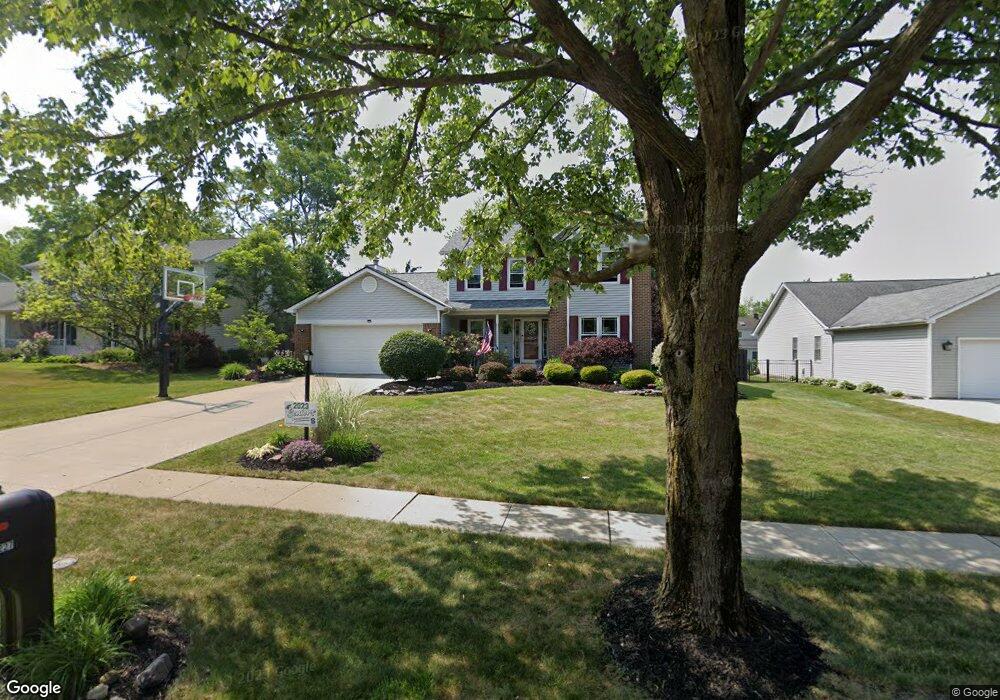
15227 Dewitt Dr Strongsville, OH 44136
Estimated Value: $318,000 - $407,000
3
Beds
3
Baths
1,998
Sq Ft
$177/Sq Ft
Est. Value
About This Home
This home is located at 15227 Dewitt Dr, Strongsville, OH 44136 and is currently estimated at $354,064, approximately $177 per square foot. 15227 Dewitt Dr is a home located in Cuyahoga County with nearby schools including Strongsville High School, Bethel Christian Academy, and Sts Joseph & John Interparochial School.
Ownership History
Date
Name
Owned For
Owner Type
Purchase Details
Closed on
Dec 16, 2011
Sold by
Heffke Steven A and Ivancic Michelle L
Bought by
Heffke Steven A and Heffke Michelle L
Current Estimated Value
Home Financials for this Owner
Home Financials are based on the most recent Mortgage that was taken out on this home.
Original Mortgage
$149,250
Outstanding Balance
$16,117
Interest Rate
3.99%
Mortgage Type
New Conventional
Estimated Equity
$337,947
Purchase Details
Closed on
Oct 22, 2002
Sold by
Pallas Thomas J and Pallas Mary Kay A
Bought by
Heffke Steven A and Ivancic Michelle L
Home Financials for this Owner
Home Financials are based on the most recent Mortgage that was taken out on this home.
Original Mortgage
$170,000
Interest Rate
6.29%
Purchase Details
Closed on
Feb 9, 1998
Sold by
Gibson Donald A and Gibson Susan F
Bought by
Pallas Thomas J and Pallas Mary Kay A
Purchase Details
Closed on
Jan 1, 1991
Bought by
Gibson Donald A and Gibson Susan F
Create a Home Valuation Report for This Property
The Home Valuation Report is an in-depth analysis detailing your home's value as well as a comparison with similar homes in the area
Home Values in the Area
Average Home Value in this Area
Purchase History
| Date | Buyer | Sale Price | Title Company |
|---|---|---|---|
| Heffke Steven A | -- | None Available | |
| Heffke Steven A | $200,000 | Real Living Title Agency Ltd | |
| Pallas Thomas J | $173,900 | Executive Title Agency Corp | |
| Gibson Donald A | -- | -- |
Source: Public Records
Mortgage History
| Date | Status | Borrower | Loan Amount |
|---|---|---|---|
| Open | Heffke Steven A | $149,250 | |
| Closed | Heffke Steven A | $170,000 |
Source: Public Records
Tax History Compared to Growth
Tax History
| Year | Tax Paid | Tax Assessment Tax Assessment Total Assessment is a certain percentage of the fair market value that is determined by local assessors to be the total taxable value of land and additions on the property. | Land | Improvement |
|---|---|---|---|---|
| 2024 | $5,380 | $114,590 | $19,250 | $95,340 |
| 2023 | $5,641 | $90,090 | $21,280 | $68,810 |
| 2022 | $5,600 | $90,090 | $21,280 | $68,810 |
| 2021 | $5,556 | $90,090 | $21,280 | $68,810 |
| 2020 | $5,414 | $77,670 | $18,340 | $59,330 |
| 2019 | $5,255 | $221,900 | $52,400 | $169,500 |
| 2018 | $4,770 | $77,670 | $18,340 | $59,330 |
| 2017 | $4,632 | $69,830 | $16,350 | $53,480 |
| 2016 | $4,595 | $69,830 | $16,350 | $53,480 |
| 2015 | $4,524 | $69,830 | $16,350 | $53,480 |
| 2014 | $4,524 | $67,800 | $15,860 | $51,940 |
Source: Public Records
Map
Nearby Homes
- 9129 Tahoe Cir
- 9890 Webster Rd
- 10010 Chevy Chase
- 9531 Nicole Cir
- 9945 Twelve Oaks Cir
- 13976 W Sprague Rd
- 14015 Byron Blvd
- Buchanan Plan at The Enclave at Pine Lakes Crossing
- Belleville Plan at The Enclave at Pine Lakes Crossing
- 0 Webster Rd
- 7685 Saratoga Rd
- 10369 Council Bluff
- 15485 Albion Rd
- 14069 Basswood Cir
- 8761 Windfall Ct
- 7664 Gerald Dr
- 16519 Albion Rd
- 14280 Pawnee Trail
- 12972 W Sprague Rd
- 14330 Pawnee Trail
- 15193 Dewitt Dr
- 15261 Dewitt Dr
- 15206 Whitney Rd
- 15240 Whitney Rd
- 15157 Dewitt Dr
- 15172 Whitney Rd
- 15204 Dewitt Dr
- 15170 Dewitt Dr
- 15238 Dewitt Dr
- 15281 Dewitt Dr
- 15138 Whitney Rd
- 15134 Dewitt Dr
- 15123 Dewitt Dr
- 15308 Whitney Rd
- 15104 Whitney Rd
- 15300 Dewitt Dr
- 15309 Dewitt Dr
- 15087 Dewitt Dr
- 15215 Sassafras Dr
- 15249 Sassafras Dr