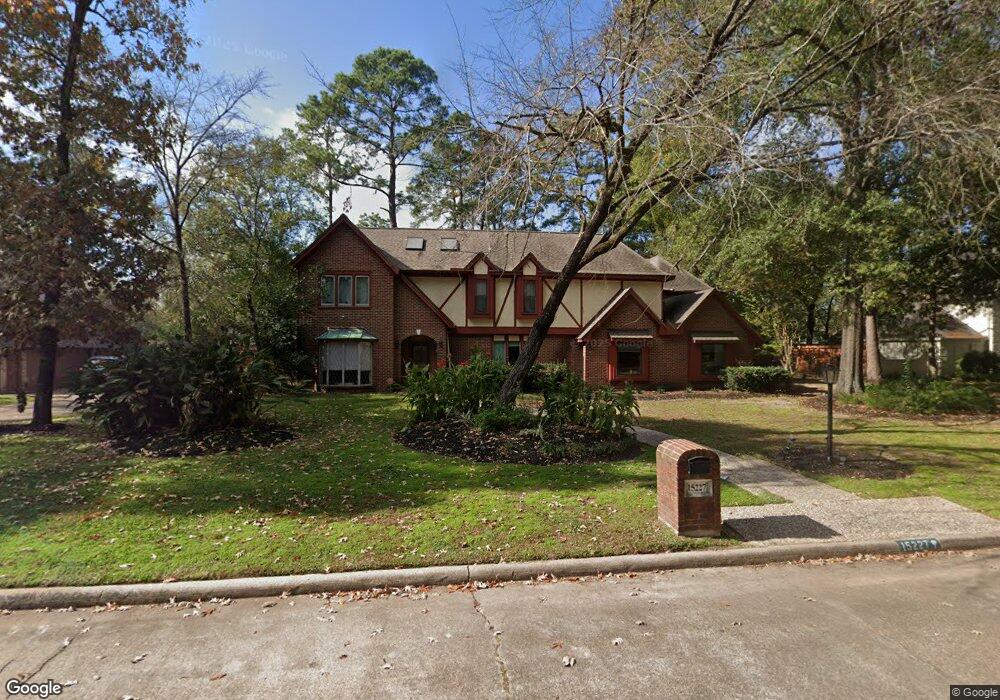
15227 Rainhollow Dr Houston, TX 77070
Estimated Value: $735,941 - $778,000
5
Beds
5
Baths
5,808
Sq Ft
$130/Sq Ft
Est. Value
About This Home
This home is located at 15227 Rainhollow Dr, Houston, TX 77070 and is currently estimated at $753,735, approximately $129 per square foot. 15227 Rainhollow Dr is a home located in Harris County with nearby schools including Lakewood Elementary School, Willow Wood Junior High School, and Northpointe Intermediate School.
Ownership History
Date
Name
Owned For
Owner Type
Purchase Details
Closed on
Jan 26, 2016
Sold by
Atkins Juanita Rimmel and Pettepher Lynnet Rimmel
Bought by
Whitehead Waylon Travis and Whitehead Amy Nicole
Current Estimated Value
Home Financials for this Owner
Home Financials are based on the most recent Mortgage that was taken out on this home.
Original Mortgage
$396,150
Outstanding Balance
$316,417
Interest Rate
4.01%
Mortgage Type
New Conventional
Estimated Equity
$437,318
Purchase Details
Closed on
Jan 20, 2016
Sold by
Rimmel Bonnie
Bought by
Rimmel Atkins Juanita Rimmel and Rimmel Pettepher Lynnet
Home Financials for this Owner
Home Financials are based on the most recent Mortgage that was taken out on this home.
Original Mortgage
$396,150
Outstanding Balance
$316,417
Interest Rate
4.01%
Mortgage Type
New Conventional
Estimated Equity
$437,318
Create a Home Valuation Report for This Property
The Home Valuation Report is an in-depth analysis detailing your home's value as well as a comparison with similar homes in the area
Home Values in the Area
Average Home Value in this Area
Purchase History
| Date | Buyer | Sale Price | Title Company |
|---|---|---|---|
| Whitehead Waylon Travis | -- | Great American Title Co | |
| Rimmel Atkins Juanita Rimmel | -- | None Available |
Source: Public Records
Mortgage History
| Date | Status | Borrower | Loan Amount |
|---|---|---|---|
| Open | Whitehead Waylon Travis | $396,150 |
Source: Public Records
Tax History Compared to Growth
Tax History
| Year | Tax Paid | Tax Assessment Tax Assessment Total Assessment is a certain percentage of the fair market value that is determined by local assessors to be the total taxable value of land and additions on the property. | Land | Improvement |
|---|---|---|---|---|
| 2025 | $15,517 | $668,054 | $103,681 | $564,373 |
| 2024 | $15,517 | $698,709 | $89,010 | $609,699 |
| 2023 | $15,517 | $625,890 | $84,119 | $541,771 |
| 2022 | $13,356 | $591,200 | $76,294 | $514,906 |
| 2021 | $12,809 | $513,502 | $58,688 | $454,814 |
| 2020 | $13,064 | $516,379 | $58,688 | $457,691 |
| 2019 | $12,197 | $516,379 | $58,688 | $457,691 |
| 2018 | $5,253 | $417,000 | $58,688 | $358,312 |
| 2017 | $11,070 | $417,000 | $58,688 | $358,312 |
| 2016 | $11,070 | $417,000 | $58,688 | $358,312 |
| 2015 | $4,282 | $491,853 | $58,688 | $433,165 |
| 2014 | $4,282 | $374,883 | $58,688 | $316,195 |
Source: Public Records
Map
Nearby Homes
- 11410 Rothglen St
- 11614 Brookfalls Dr
- 11707 Hillbrook Dr
- 15118 Stillcreek Dr
- 15418 Waldwick Dr
- 15102 Rolling Oaks Dr
- 11814 Golden Pine Dr
- 11715 Park Creek Dr
- 15522 Waldwick Dr
- 15014 River Park Dr
- 12 Lakeview Place
- 15603 Lakewood Terrace Dr
- 15326 Gettysburg Dr
- 15207 Hillbrook Ct
- 15603 Canterbury Forest Dr
- 15214 River Park Dr
- 15206 Beacham Dr
- 14907 Pine Point Ct
- 15703 Downford Dr
- 15215 River Park Dr
- 15223 Rainhollow Dr
- 15226 Rainhollow Dr
- 15230 Rainhollow Dr
- 15235 Rainhollow Dr
- 15222 Rainhollow Dr
- 11510 Hylander Dr
- 15215 Rainhollow Dr
- 15218 Rainhollow Dr
- 15231 Lakewood Forest Dr
- 11506 Hylander Dr
- 15227 Lakewood Forest Dr
- 11602 Stillwater Dr
- 15223 Lakewood Forest Dr
- 11603 Hillbrook Dr
- 11603 Stillwater Dr
- 11607 Hillbrook Dr
- 11606 Stillwater Dr
- 15211 Rainhollow Dr
- 11502 Hylander Dr
- 15214 Rainhollow Dr