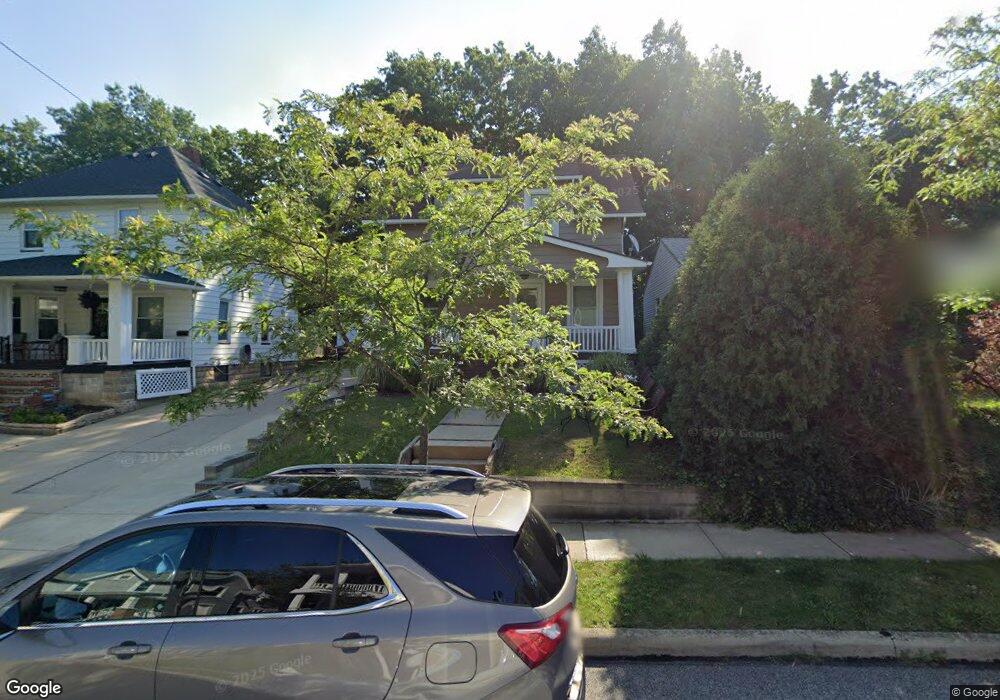
1523 Hopkins Ave Lakewood, OH 44107
Estimated Value: $148,000 - $218,000
2
Beds
2
Baths
541
Sq Ft
$338/Sq Ft
Est. Value
About This Home
This home is located at 1523 Hopkins Ave, Lakewood, OH 44107 and is currently estimated at $182,779, approximately $337 per square foot. 1523 Hopkins Ave is a home located in Cuyahoga County with nearby schools including Harrison Elementary School, Garfield Middle School, and Lakewood High School.
Ownership History
Date
Name
Owned For
Owner Type
Purchase Details
Closed on
Oct 17, 2010
Sold by
Gersna Robert and Gersna Gail
Bought by
Berila Blaine R
Current Estimated Value
Home Financials for this Owner
Home Financials are based on the most recent Mortgage that was taken out on this home.
Original Mortgage
$55,000
Outstanding Balance
$36,202
Interest Rate
4.3%
Mortgage Type
Purchase Money Mortgage
Estimated Equity
$146,577
Purchase Details
Closed on
Jun 5, 2001
Sold by
Mcdonnell Timothy M and Mcdonnell Denise
Bought by
Gersna Robert and Gersna Gail
Home Financials for this Owner
Home Financials are based on the most recent Mortgage that was taken out on this home.
Original Mortgage
$62,500
Interest Rate
7.18%
Purchase Details
Closed on
Dec 14, 1984
Sold by
Powers Mary E
Bought by
Mcdonnell Timothy M
Purchase Details
Closed on
Jan 1, 1975
Bought by
Powers Mary E
Create a Home Valuation Report for This Property
The Home Valuation Report is an in-depth analysis detailing your home's value as well as a comparison with similar homes in the area
Home Values in the Area
Average Home Value in this Area
Purchase History
| Date | Buyer | Sale Price | Title Company |
|---|---|---|---|
| Berila Blaine R | $74,000 | Pvf | |
| Gersna Robert | $70,000 | Title Access Llc | |
| Mcdonnell Timothy M | $27,000 | -- | |
| Powers Mary E | -- | -- |
Source: Public Records
Mortgage History
| Date | Status | Borrower | Loan Amount |
|---|---|---|---|
| Open | Berila Blaine R | $55,000 | |
| Previous Owner | Gersna Robert | $62,500 |
Source: Public Records
Tax History Compared to Growth
Tax History
| Year | Tax Paid | Tax Assessment Tax Assessment Total Assessment is a certain percentage of the fair market value that is determined by local assessors to be the total taxable value of land and additions on the property. | Land | Improvement |
|---|---|---|---|---|
| 2024 | $2,698 | $42,000 | $14,210 | $27,790 |
| 2023 | $2,903 | $38,680 | $11,240 | $27,440 |
| 2022 | $2,922 | $38,680 | $11,240 | $27,440 |
| 2021 | $2,892 | $38,680 | $11,240 | $27,440 |
| 2020 | $2,329 | $27,230 | $7,910 | $19,320 |
| 2019 | $2,283 | $77,800 | $22,600 | $55,200 |
| 2018 | $2,279 | $27,230 | $7,910 | $19,320 |
| 2017 | $2,291 | $24,860 | $8,720 | $16,140 |
| 2016 | $2,275 | $24,860 | $8,720 | $16,140 |
| 2015 | $3,708 | $24,860 | $8,720 | $16,140 |
| 2014 | $3,708 | $24,860 | $8,720 | $16,140 |
Source: Public Records
Map
Nearby Homes
- 1486 Hopkins Ave
- 1518 Hopkins Ave
- 1461 Newman Ave
- 1563 Winchester Ave
- 11901 Detroit Ave
- 1412 Winchester Ave
- 12115 Detroit Ave
- 1569 Newman Ave
- 1584 Newman Ave
- 12110 Detroit Ave
- 12118 Detroit Ave
- 12122 Detroit Ave
- 1391 Beach Ave
- 1622 Winchester Ave
- 1633 Hopkins Ave
- 1484 Alameda Ave
- 1477 W 116th St
- 1341 Beach Ave
- 1598 Alameda Ave
- 1585 Cohassett Ave
- 1527 Hopkins Ave
- 1519 Hopkins Ave
- 1531 Hopkins Ave
- 1515 Hopkins Ave
- 1535 Hopkins Ave
- 1513 Hopkins Ave
- 1511 Hopkins Ave
- 1510 Newman Ave
- 1510 Newman Ave Unit 2BR
- 1510 Newman Ave
- 1522 Hopkins Ave
- 1539 Hopkins Ave Unit 1539
- 1528 Hopkins Ave
- 11922 Franklin Blvd
- 1507 Hopkins Ave
- 1514 Hopkins Ave
- 1532 Hopkins Ave Unit 34
- 1541 Hopkins Ave
- 1541 Hopkins Ave Unit 1539
- 11918 Franklin Blvd