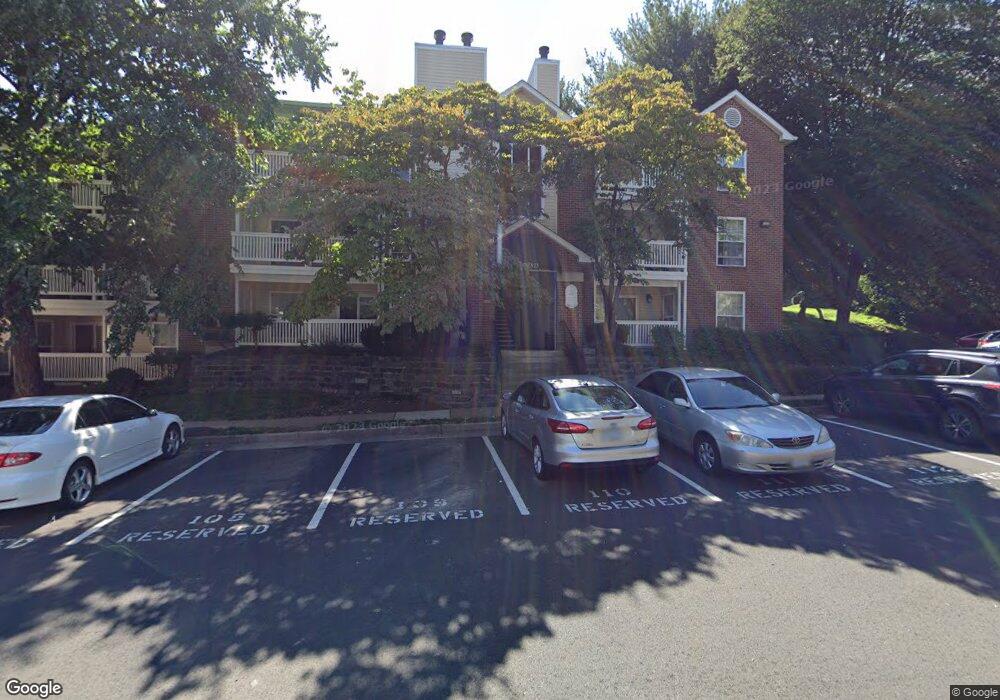
1523 Lincoln Way Unit 302B McLean, VA 22102
Tysons Corner NeighborhoodEstimated Value: $269,900 - $276,000
1
Bed
1
Bath
690
Sq Ft
$396/Sq Ft
Est. Value
About This Home
This home is located at 1523 Lincoln Way Unit 302B, McLean, VA 22102 and is currently estimated at $272,950, approximately $395 per square foot. 1523 Lincoln Way Unit 302B is a home located in Fairfax County with nearby schools including Spring Hill Elementary School, Longfellow Middle School, and McLean High School.
Ownership History
Date
Name
Owned For
Owner Type
Purchase Details
Closed on
Feb 3, 2009
Sold by
Federal Home Loan Mortgag
Bought by
Morton William E
Current Estimated Value
Purchase Details
Closed on
Oct 25, 2007
Sold by
Joa Jea Chim
Bought by
Seo Yu H
Home Financials for this Owner
Home Financials are based on the most recent Mortgage that was taken out on this home.
Original Mortgage
$290,000
Interest Rate
6.39%
Mortgage Type
New Conventional
Purchase Details
Closed on
Jun 28, 2006
Sold by
Young K Lee
Bought by
Joa Jea Chim
Home Financials for this Owner
Home Financials are based on the most recent Mortgage that was taken out on this home.
Original Mortgage
$246,400
Interest Rate
6.58%
Mortgage Type
New Conventional
Purchase Details
Closed on
Sep 10, 2003
Sold by
Zhang Zhiqing
Bought by
Lee Yougn K
Home Financials for this Owner
Home Financials are based on the most recent Mortgage that was taken out on this home.
Original Mortgage
$153,600
Interest Rate
6.22%
Mortgage Type
New Conventional
Create a Home Valuation Report for This Property
The Home Valuation Report is an in-depth analysis detailing your home's value as well as a comparison with similar homes in the area
Home Values in the Area
Average Home Value in this Area
Purchase History
| Date | Buyer | Sale Price | Title Company |
|---|---|---|---|
| Morton William E | $204,500 | -- | |
| Seo Yu H | $290,000 | -- | |
| Joa Jea Chim | $308,000 | -- | |
| Lee Yougn K | $192,000 | -- |
Source: Public Records
Mortgage History
| Date | Status | Borrower | Loan Amount |
|---|---|---|---|
| Previous Owner | Seo Yu H | $290,000 | |
| Previous Owner | Joa Jea Chim | $246,400 | |
| Previous Owner | Lee Yougn K | $153,600 |
Source: Public Records
Tax History Compared to Growth
Tax History
| Year | Tax Paid | Tax Assessment Tax Assessment Total Assessment is a certain percentage of the fair market value that is determined by local assessors to be the total taxable value of land and additions on the property. | Land | Improvement |
|---|---|---|---|---|
| 2025 | $2,726 | $250,380 | $50,000 | $200,380 |
| 2024 | $2,726 | $225,570 | $45,000 | $180,570 |
| 2023 | $2,461 | $208,860 | $42,000 | $166,860 |
| 2022 | $2,444 | $204,760 | $41,000 | $163,760 |
| 2021 | $2,665 | $217,830 | $44,000 | $173,830 |
| 2020 | $2,828 | $229,290 | $46,000 | $183,290 |
| 2019 | $2,828 | $229,290 | $46,000 | $183,290 |
| 2018 | $2,611 | $227,020 | $45,000 | $182,020 |
| 2017 | $2,520 | $208,070 | $42,000 | $166,070 |
| 2016 | $2,823 | $233,590 | $47,000 | $186,590 |
| 2015 | $2,808 | $240,810 | $48,000 | $192,810 |
| 2014 | $2,723 | $236,090 | $47,000 | $189,090 |
Source: Public Records
Map
Nearby Homes
- 1517 Lincoln Way Unit 304
- 8220 Crestwood Heights Dr Unit 314
- 8220 Crestwood Heights Dr Unit 315
- 8220 Crestwood Heights Dr Unit 418
- 8220 Crestwood Heights Dr Unit 712
- 8220 Crestwood Heights Dr Unit 1215
- 8220 Crestwood Heights Dr Unit 714
- 8220 Crestwood Heights Dr Unit 807
- 1532 Lincoln Way Unit 203
- 1530 Lincoln Way Unit 202A
- 1504 Lincoln Way Unit 104
- 1543 Lincoln Way Unit 301
- 1501 Lincoln Way Unit 101
- 8350 Greensboro Dr Unit 807 AND 809
- 8350 Greensboro Dr Unit 517
- 8340 Greensboro Dr Unit 402
- 1645 International Dr Unit 125
- 8360 Greensboro Dr Unit 516
- 8360 Greensboro Dr Unit 305
- 8370 Greensboro Dr Unit 203
- 1523 Lincoln Way Unit 201
- 1523 Lincoln Way Unit 303B
- 1523 Lincoln Way Unit 202
- 1523 Lincoln Way Unit 103
- 1523 Lincoln Way Unit 311
- 1523 Lincoln Way Unit 304
- 1523 Lincoln Way Unit 102
- 1523 Lincoln Way Unit 104
- 1523 Lincoln Way Unit 204 B
- 1523 Lincoln Way Unit 301B
- 1521 Lincoln Way Unit 202
- 1521 Lincoln Way Unit 104A
- 1521 Lincoln Way Unit 302A
- 1521 Lincoln Way Unit 303
- 1521 Lincoln Way Unit 103
- 1521 Lincoln Way Unit 301A
- 1521 Lincoln Way Unit 204A
- 1521 Lincoln Way Unit 304
- 1521 Lincoln Way Unit 101
- 1521 Lincoln Way Unit 203