Estimated Value: $294,000 - $337,545
About This Home
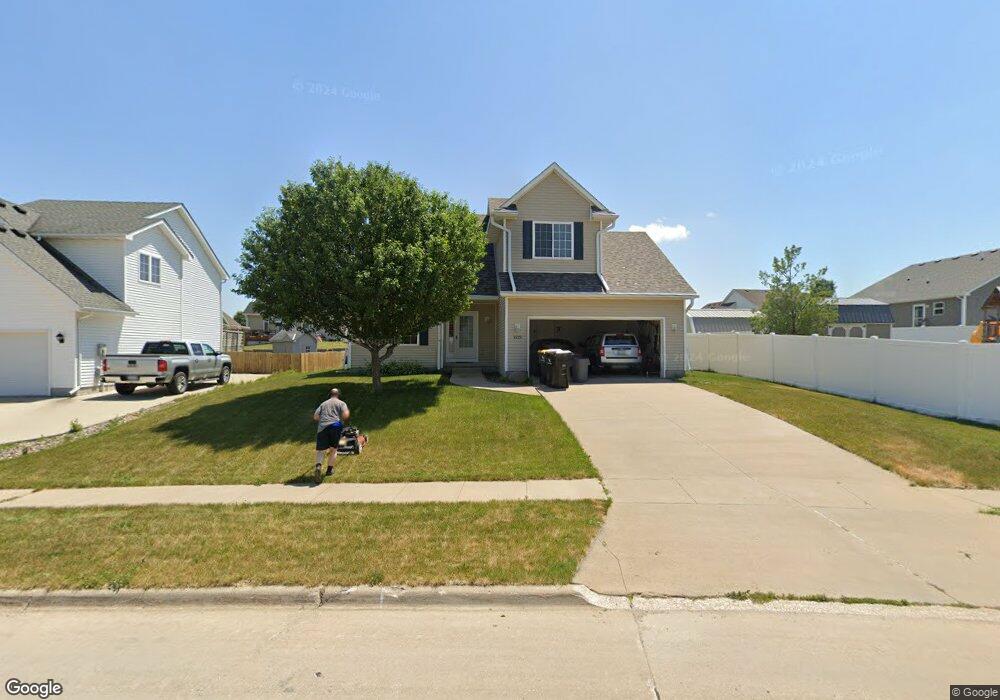
This home is located at 1523 Maple Dr, Adel, IA 50003 and is currently estimated at $320,386, approximately $193 per square foot. 1523 Maple Dr is a home located in Dallas County with nearby schools including Meadow View Elementary, Adel Elementary School, and ADM Middle School.
Ownership History
We collect this data history from publicly available records. To have your information removed, we recommend requesting removal directly through your county’s website.
Purchase Details
Home Financials for this Owner
Home Financials are based on the most recent Mortgage that was taken out on this home.Home Values in the Area
Average Home Value in this Area
Purchase History
We collect this data history from publicly available records. To have your information removed, we recommend requesting removal directly through your county’s website.
| Date | Buyer | Sale Price | Title Company |
|---|---|---|---|
| $175,000 | None Available |
Mortgage History
We collect this data history from publicly available records. To have your information removed, we recommend requesting removal directly through your county’s website.
| Date | Status | Borrower | Loan Amount |
|---|---|---|---|
| Closed | $100,700 | ||
| Closed | $139,920 |
Tax History
We collect this data history from publicly available records. To have your information removed, we recommend requesting removal directly through your county’s website.
| Year | Tax Paid | Tax Assessment Tax Assessment Total Assessment is a certain percentage of the fair market value that is determined by local assessors to be the total taxable value of land and additions on the property. | Land | Improvement |
|---|---|---|---|---|
| 2025 | $4,328 | $293,290 | $55,000 | $238,290 |
| 2024 | $4,474 | $286,480 | $55,000 | $231,480 |
| 2023 | $4,474 | $268,430 | $50,000 | $218,430 |
| 2022 | $3,970 | $236,470 | $50,000 | $186,470 |
| 2021 | $3,970 | $212,930 | $50,000 | $162,930 |
| 2020 | $4,076 | $207,300 | $50,000 | $157,300 |
| 2019 | $4,074 | $207,300 | $50,000 | $157,300 |
| 2018 | $4,074 | $198,320 | $45,000 | $153,320 |
| 2017 | $3,760 | $198,320 | $45,000 | $153,320 |
| 2016 | $3,590 | $186,930 | $29,920 | $157,010 |
| 2015 | $3,602 | $182,220 | $0 | $0 |
| 2014 | $3,602 | $182,220 | $0 | $0 |
Map
- 509 S 13th St
- 1301 S 13th St
- 1307 S 13th St
- 1307 Greene St
- 1210 S 11th St
- 835 S 11th St
- 1301 S 11th St
- 0 van Fossen Ln
- 1304 S 10th St
- 402 S 11th St
- 820 Greenwood Hills Dr
- 1014 Greene St
- 1133 Prairie St
- 1007 Lynne Dr
- 1131 Prairie St
- 1717 Court St
- 904 Cottage St
- 912 Greene St
- 1735 Sadie Ln
- 818 Evans View Dr
Ask me questions while you tour the home.