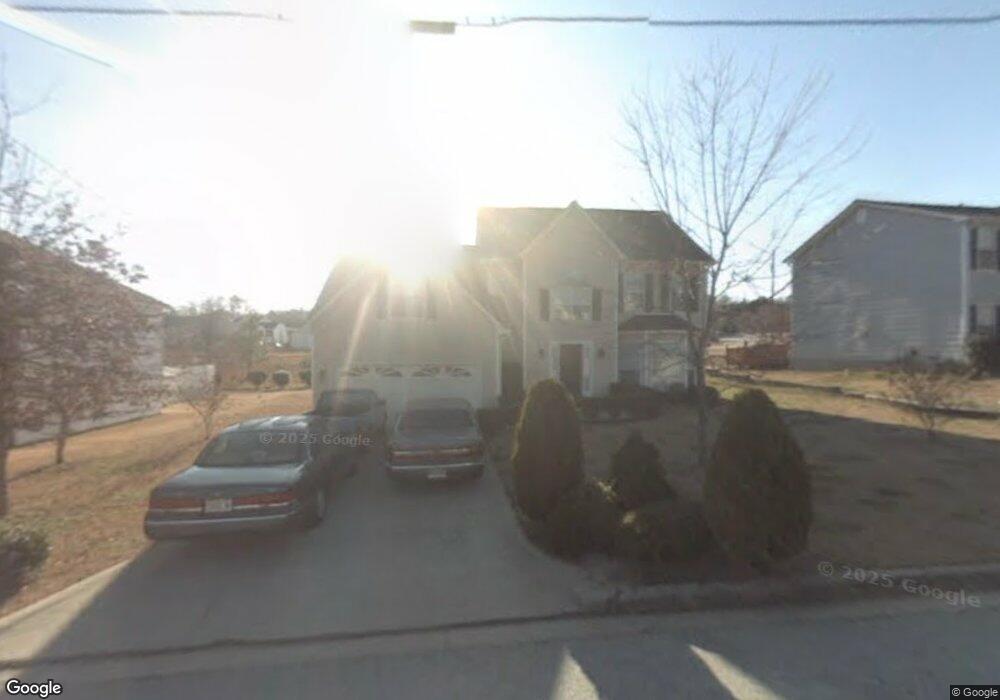
1523 Smithson Dr Unit I Lithonia, GA 30058
Estimated Value: $306,134 - $342,000
3
Beds
3
Baths
2,655
Sq Ft
$120/Sq Ft
Est. Value
About This Home
This home is located at 1523 Smithson Dr Unit I, Lithonia, GA 30058 and is currently estimated at $319,534, approximately $120 per square foot. 1523 Smithson Dr Unit I is a home located in DeKalb County with nearby schools including Princeton Elementary School, Lithonia Middle School, and Lithonia High School.
Ownership History
Date
Name
Owned For
Owner Type
Purchase Details
Closed on
Jul 1, 2021
Sold by
Murrell Gladys S
Bought by
Allen Stacy
Current Estimated Value
Home Financials for this Owner
Home Financials are based on the most recent Mortgage that was taken out on this home.
Original Mortgage
$164,900
Outstanding Balance
$149,296
Interest Rate
2.9%
Mortgage Type
New Conventional
Estimated Equity
$170,238
Purchase Details
Closed on
Aug 15, 2012
Sold by
Pettus Terry T
Bought by
Pettus Gladys S Murrell
Home Financials for this Owner
Home Financials are based on the most recent Mortgage that was taken out on this home.
Original Mortgage
$129,285
Interest Rate
3.58%
Mortgage Type
New Conventional
Purchase Details
Closed on
Jul 14, 1993
Sold by
Palace Develop Inc
Bought by
Palace Homes Inc
Home Financials for this Owner
Home Financials are based on the most recent Mortgage that was taken out on this home.
Original Mortgage
$102,600
Interest Rate
7.48%
Mortgage Type
FHA
Create a Home Valuation Report for This Property
The Home Valuation Report is an in-depth analysis detailing your home's value as well as a comparison with similar homes in the area
Home Values in the Area
Average Home Value in this Area
Purchase History
| Date | Buyer | Sale Price | Title Company |
|---|---|---|---|
| Allen Stacy | -- | -- | |
| Pettus Gladys S Murrell | -- | -- | |
| Palace Homes Inc | $20,000 | -- | |
| Murrell Gladys S | $101,900 | -- |
Source: Public Records
Mortgage History
| Date | Status | Borrower | Loan Amount |
|---|---|---|---|
| Open | Allen Stacy | $164,900 | |
| Previous Owner | Pettus Gladys S Murrell | $129,285 | |
| Previous Owner | Murrell Gladys S | $102,600 |
Source: Public Records
Tax History Compared to Growth
Tax History
| Year | Tax Paid | Tax Assessment Tax Assessment Total Assessment is a certain percentage of the fair market value that is determined by local assessors to be the total taxable value of land and additions on the property. | Land | Improvement |
|---|---|---|---|---|
| 2025 | $3,505 | $118,960 | $16,000 | $102,960 |
| 2024 | $3,742 | $124,560 | $16,000 | $108,560 |
| 2023 | $3,742 | $121,600 | $16,000 | $105,600 |
| 2022 | $3,325 | $108,720 | $10,000 | $98,720 |
| 2021 | $3,699 | $76,400 | $10,000 | $66,400 |
| 2020 | $3,341 | $68,240 | $10,000 | $58,240 |
| 2019 | $3,046 | $61,520 | $10,000 | $51,520 |
| 2018 | $1,561 | $55,240 | $10,000 | $45,240 |
| 2017 | $346 | $44,280 | $7,440 | $36,840 |
| 2016 | $346 | $39,440 | $7,440 | $32,000 |
| 2014 | $346 | $24,800 | $7,400 | $17,400 |
Source: Public Records
Map
Nearby Homes
- 1569 Smithson Cove
- 6463 Castle Court Way
- 6531 Edenfield Dr
- 6242 Redan Overlook Unit 6
- 6449 Rebecca Lou Ln Unit 3
- 6231 Redan Overlook
- 6405 Swift Creek Dr
- 6202 Redan Overlook
- 1784 S Deshon Rd
- 2000 Stone Mountain Lithonia Rd
- 6378 Redan Square
- 6361 Redan Square
- 6507 Swift Creek Dr
- 2017 S Deshon Rd
- 6504 Swift Creek Dr
- 1691 Redan W
- 6492 Swift Creek Rd
- 1629 Phillips Rd
- 1309 Sandybrook Ct
- 6536 Deshon Ct
- 6461 Castle Downs Trace
- 1537 Smithson Dr Unit 1
- 6451 Castle Downs Trace
- 6482 Castle Downs Ct
- 6450 Castle Downs Trace
- 6447 Castle Downs Trace Unit 2
- 6483 Castle Downs Ct
- 6488 Castle Downs Ct
- 6451 Edenfield Dr
- 6489 Castle Downs Ct
- 6442 Castle Downs Trace Unit 2
- 6441 Castle Downs Trace
- 6494 Castle Downs Ct
- 6465 Edenfield Dr
- 6443 Edenfield Dr
- 6495 Castle Downs Ct
- 1555 Smithson Dr Unit 51
- 1555 Smithson Dr
- 6434 Castle Downs Trace
- 6435 Castle Downs Trace Unit 2