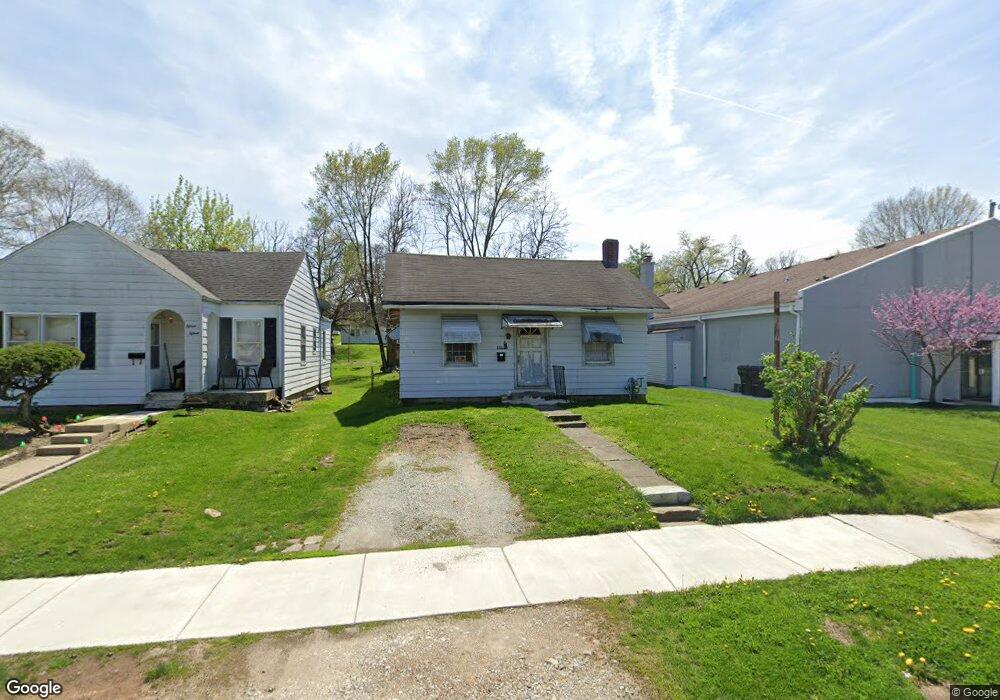
1523 W 9th St Anderson, IN 46016
Estimated Value: $86,000 - $97,987
2
Beds
1
Bath
1,830
Sq Ft
$50/Sq Ft
Est. Value
About This Home
This home is located at 1523 W 9th St, Anderson, IN 46016 and is currently estimated at $91,997, approximately $50 per square foot. 1523 W 9th St is a home located in Madison County with nearby schools including Tenth Street Elementary School, Highland Middle School, and Anderson High School.
Ownership History
Date
Name
Owned For
Owner Type
Purchase Details
Closed on
Oct 22, 2014
Sold by
M Jewell Llc
Bought by
Love Carl
Current Estimated Value
Purchase Details
Closed on
Sep 26, 2013
Sold by
Madison County Auditor
Bought by
M Jewell Llc
Purchase Details
Closed on
Aug 15, 2008
Sold by
Capital Equity Partners Llc
Bought by
Go Invest Wisely Llc
Purchase Details
Closed on
Aug 14, 2008
Sold by
Household Finance Corp Iii
Bought by
Capital Equity Partners Llc
Purchase Details
Closed on
Nov 9, 2007
Sold by
Perry Lucy M
Bought by
Household Finance Corp Iii
Create a Home Valuation Report for This Property
The Home Valuation Report is an in-depth analysis detailing your home's value as well as a comparison with similar homes in the area
Home Values in the Area
Average Home Value in this Area
Purchase History
| Date | Buyer | Sale Price | Title Company |
|---|---|---|---|
| Love Carl | -- | -- | |
| M Jewell Llc | -- | -- | |
| Go Invest Wisely Llc | -- | -- | |
| Capital Equity Partners Llc | -- | -- | |
| Household Finance Corp Iii | $22,663 | -- |
Source: Public Records
Tax History Compared to Growth
Tax History
| Year | Tax Paid | Tax Assessment Tax Assessment Total Assessment is a certain percentage of the fair market value that is determined by local assessors to be the total taxable value of land and additions on the property. | Land | Improvement |
|---|---|---|---|---|
| 2024 | $562 | $53,200 | $6,200 | $47,000 |
| 2023 | $528 | $48,700 | $5,900 | $42,800 |
| 2022 | $534 | $49,100 | $5,800 | $43,300 |
| 2021 | $492 | $45,000 | $5,700 | $39,300 |
| 2020 | $473 | $43,100 | $5,500 | $37,600 |
| 2019 | $629 | $42,000 | $5,500 | $36,500 |
| 2018 | $665 | $39,800 | $5,500 | $34,300 |
| 2017 | $403 | $39,100 | $5,500 | $33,600 |
| 2016 | $633 | $39,100 | $5,500 | $33,600 |
| 2014 | $822 | $41,100 | $5,700 | $35,400 |
| 2013 | $822 | $41,100 | $5,700 | $35,400 |
Source: Public Records
Map
Nearby Homes