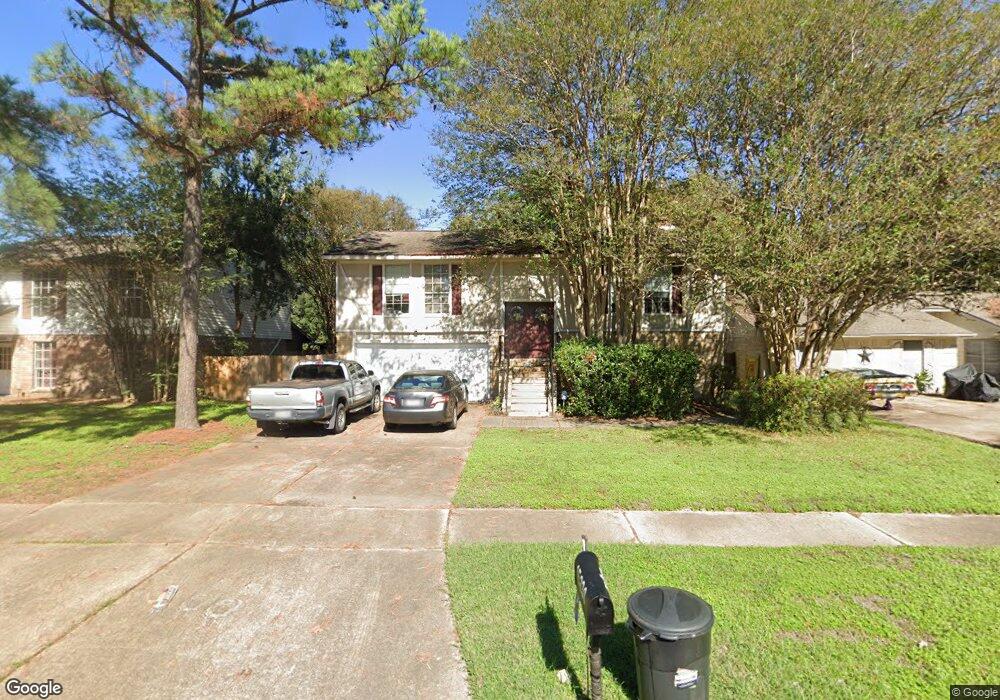
15230 Pebble Lake Dr Houston, TX 77095
Estimated Value: $250,199 - $273,000
3
Beds
2
Baths
1,728
Sq Ft
$152/Sq Ft
Est. Value
About This Home
This home is located at 15230 Pebble Lake Dr, Houston, TX 77095 and is currently estimated at $262,050, approximately $151 per square foot. 15230 Pebble Lake Dr is a home located in Harris County with nearby schools including Fiest Elementary School, Labay Middle School, and Cypress Falls High School.
Ownership History
Date
Name
Owned For
Owner Type
Purchase Details
Closed on
Aug 28, 1997
Sold by
Federal Home Loan Mortgage Corporation
Bought by
Bye Theresa A
Current Estimated Value
Home Financials for this Owner
Home Financials are based on the most recent Mortgage that was taken out on this home.
Original Mortgage
$60,140
Outstanding Balance
$9,287
Interest Rate
7.43%
Estimated Equity
$252,763
Purchase Details
Closed on
Feb 20, 1997
Sold by
Chase Mtg Services Inc
Bought by
Federal Home Loan Mortgage Corporation
Purchase Details
Closed on
Feb 4, 1997
Sold by
Frappier Robert F
Bought by
Chase Mtg Services Inc
Purchase Details
Closed on
Dec 1, 1994
Sold by
Lewis Byron S
Bought by
Marz Steve Joseph and Marz Mary Tyler
Home Financials for this Owner
Home Financials are based on the most recent Mortgage that was taken out on this home.
Original Mortgage
$72,200
Interest Rate
8.99%
Create a Home Valuation Report for This Property
The Home Valuation Report is an in-depth analysis detailing your home's value as well as a comparison with similar homes in the area
Home Values in the Area
Average Home Value in this Area
Purchase History
| Date | Buyer | Sale Price | Title Company |
|---|---|---|---|
| Bye Theresa A | -- | Texas American Title Company | |
| Federal Home Loan Mortgage Corporation | -- | -- | |
| Chase Mtg Services Inc | $55,250 | -- | |
| Marz Steve Joseph | -- | First American Title |
Source: Public Records
Mortgage History
| Date | Status | Borrower | Loan Amount |
|---|---|---|---|
| Open | Bye Theresa A | $60,140 | |
| Previous Owner | Marz Steve Joseph | $72,200 |
Source: Public Records
Tax History Compared to Growth
Tax History
| Year | Tax Paid | Tax Assessment Tax Assessment Total Assessment is a certain percentage of the fair market value that is determined by local assessors to be the total taxable value of land and additions on the property. | Land | Improvement |
|---|---|---|---|---|
| 2025 | $1,174 | $228,838 | $55,415 | $173,423 |
| 2024 | $1,174 | $237,018 | $55,415 | $181,603 |
| 2023 | $1,174 | $244,281 | $55,415 | $188,866 |
| 2022 | $4,422 | $220,779 | $50,497 | $170,282 |
| 2021 | $4,243 | $173,801 | $50,497 | $123,304 |
| 2020 | $3,991 | $164,886 | $41,971 | $122,915 |
| 2019 | $3,736 | $134,000 | $27,216 | $106,784 |
| 2018 | $1,103 | $127,035 | $27,216 | $99,819 |
| 2017 | $3,877 | $140,000 | $27,216 | $112,784 |
| 2016 | $3,524 | $141,608 | $27,216 | $114,392 |
| 2015 | $1,623 | $127,662 | $27,216 | $100,446 |
| 2014 | $1,623 | $112,343 | $22,625 | $89,718 |
Source: Public Records
Map
Nearby Homes
- 15362 Meadow Village Dr
- 15414 Swan Creek Dr
- 15415 Swan Creek Dr
- 15314 Tysor Park Ln
- 9111 Baber Dr
- 9119 Baber Dr
- 9203 Baber Run Cir
- 15242 Shapiro Springs Ln
- 9303 Rush Mill Ct
- 15634 Haleys Landing Ln
- 9227 Baber Run Cir
- 15610 Tarpon Springs Ct
- 9307 Rush Mill Ct
- 15611 Meadow Village Dr
- 8747 Cypressbrook Dr
- 15303 Baber Ct
- 15339 Glenwood Park Dr
- 15610 Manorford Ct
- 15627 Kentwater Ct
- Highway 6 N & Huffmeister Rd
- 15234 Pebble Lake Dr
- 15226 Pebble Lake Dr
- 15302 Pebble Lake Dr
- 15222 Pebble Lake Dr
- 15231 Pebble Lake Dr
- 15227 Pebble Lake Dr
- 15306 Pebble Lake Dr
- 15218 Pebble Lake Dr
- 15223 Pebble Lake Dr
- 15303 Pebble Lake Dr
- 15219 Pebble Lake Dr
- 15310 Pebble Lake Dr
- 15214 Pebble Lake Dr
- 15307 Meadow Village Dr
- 15307 Pebble Lake Dr
- 8539 Pearl Lake Dr
- 15314 Pebble Lake Dr
- 15310 Meadow Village Dr
- 15210 Pebble Lake Dr
- 15311 Pebble Lake Dr