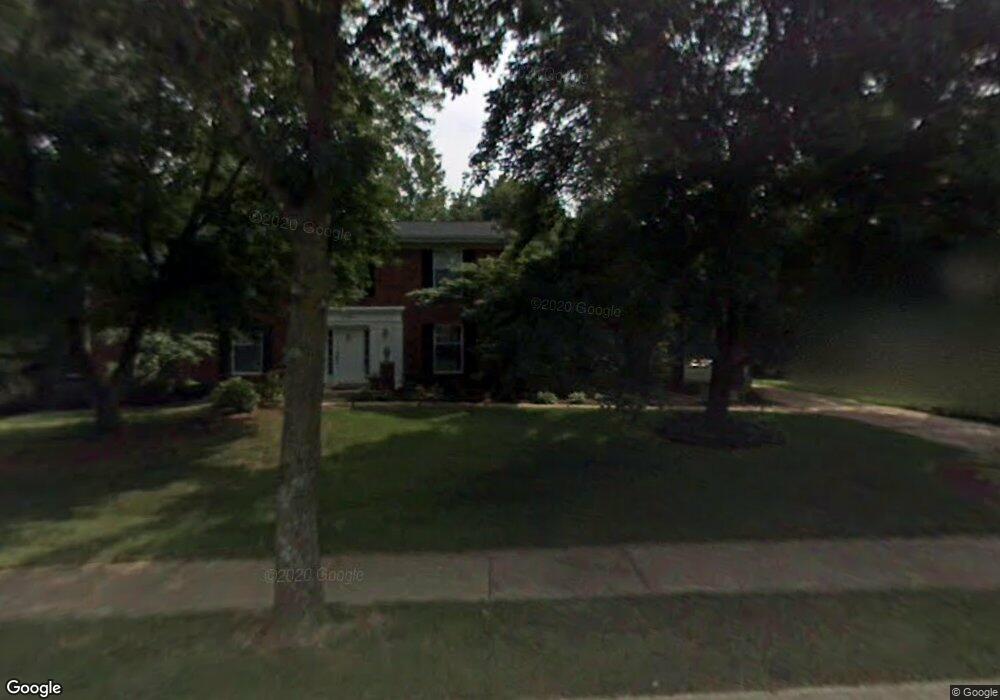
15238 Isleview Dr Chesterfield, MO 63017
Estimated Value: $652,000 - $743,000
5
Beds
4
Baths
3,668
Sq Ft
$190/Sq Ft
Est. Value
About This Home
This home is located at 15238 Isleview Dr, Chesterfield, MO 63017 and is currently estimated at $695,643, approximately $189 per square foot. 15238 Isleview Dr is a home located in St. Louis County with nearby schools including Claymont Elementary School, Parkway West Middle School, and Parkway West High School.
Ownership History
Date
Name
Owned For
Owner Type
Purchase Details
Closed on
Jun 18, 2020
Sold by
Lancia Paul G and Lancia Stephanie J
Bought by
Lancia Paul J and Lancia Stephen J
Current Estimated Value
Purchase Details
Closed on
Jun 6, 2007
Sold by
Schwartz Jonathan F and Schwartz Kirsten E
Bought by
Lancia Paul G and Lancia Stephanie J
Home Financials for this Owner
Home Financials are based on the most recent Mortgage that was taken out on this home.
Original Mortgage
$175,000
Outstanding Balance
$106,907
Interest Rate
6.16%
Mortgage Type
Purchase Money Mortgage
Estimated Equity
$588,736
Purchase Details
Closed on
Jul 17, 2001
Sold by
Prentis Louis J and Prentis Elizabeth A
Bought by
Schwartz Jonathan Francis and Schwartz Kristen Eichoff
Home Financials for this Owner
Home Financials are based on the most recent Mortgage that was taken out on this home.
Original Mortgage
$272,000
Interest Rate
7.18%
Create a Home Valuation Report for This Property
The Home Valuation Report is an in-depth analysis detailing your home's value as well as a comparison with similar homes in the area
Home Values in the Area
Average Home Value in this Area
Purchase History
| Date | Buyer | Sale Price | Title Company |
|---|---|---|---|
| Lancia Paul J | -- | None Available | |
| Lancia Paul G | $419,000 | None Available | |
| Schwartz Jonathan Francis | $340,000 | -- |
Source: Public Records
Mortgage History
| Date | Status | Borrower | Loan Amount |
|---|---|---|---|
| Open | Lancia Paul G | $175,000 | |
| Previous Owner | Schwartz Jonathan Francis | $272,000 |
Source: Public Records
Tax History Compared to Growth
Tax History
| Year | Tax Paid | Tax Assessment Tax Assessment Total Assessment is a certain percentage of the fair market value that is determined by local assessors to be the total taxable value of land and additions on the property. | Land | Improvement |
|---|---|---|---|---|
| 2025 | $7,098 | $114,170 | $39,940 | $74,230 |
| 2024 | $7,098 | $109,840 | $35,490 | $74,350 |
| 2023 | $6,998 | $109,840 | $35,490 | $74,350 |
| 2022 | $6,482 | $92,460 | $31,070 | $61,390 |
| 2021 | $6,444 | $92,460 | $31,070 | $61,390 |
| 2020 | $5,988 | $81,400 | $26,620 | $54,780 |
| 2019 | $5,921 | $81,400 | $26,620 | $54,780 |
| 2018 | $5,983 | $76,320 | $22,190 | $54,130 |
| 2017 | $5,812 | $76,320 | $22,190 | $54,130 |
| 2016 | $5,293 | $66,100 | $13,280 | $52,820 |
| 2015 | $5,543 | $66,100 | $13,280 | $52,820 |
| 2014 | $5,395 | $68,510 | $16,320 | $52,190 |
Source: Public Records
Map
Nearby Homes
- 612 Corley Ct
- 15371 Timber Hill Ln
- 258 Meadowbrook Country Club Estate
- 15464 Country Ridge Dr
- 259 Meadowbrook Country Club Estate
- 15575 Meadowbrook Circle Ln
- 2323 Manor Grove Dr Unit 4
- 2387 Baxton Way
- 2314 Manor Grove Dr Unit 3
- 2335 Manor Grove Dr Unit 9
- 15 Meadowbrook Country Club Estate
- 2259 Sycamore Dr
- 15248 Clayton Rd
- 15047 Green Circle Dr
- 770 Straub Rd
- 1917 Dewitt Ridge Dr Unit 37
- 15822 Harris Ridge Ct Unit 85
- 509 Antioch Ln
- 15009 Claymoor Ct Unit 15
- 15009 Claymoor Ct Unit 11
- 15242 Isleview Dr
- 15232 Isleview Dr
- 15233 Isleview Dr
- 15241 Isleview Dr
- 1755 Lochcrest Dr
- 15226 Isleview Dr
- 1740 Lochcrest Dr
- 15225 Isleview Dr
- 1743 Lochcrest Dr
- 15218 Isleview Dr
- 15230 Lochcrest Ct
- 15217 Isleview Dr
- 15223 Lochcrest Ct
- 513 Richley Dr
- 1728 Lochcrest Dr
- 1731 Lochcrest Dr
- 15210 Isleview Dr
- 512 Richley Dr
- 15244 Lochcrest Ct
- 1716 Lochcrest Dr