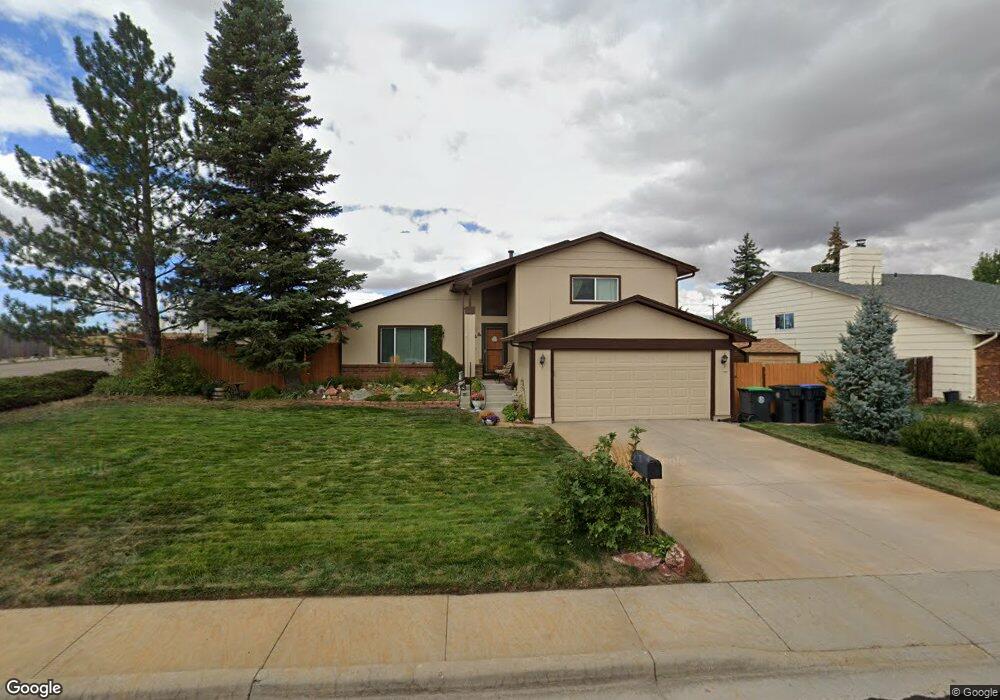
1524 Elkhorn Dr Cheyenne, WY 82007
Estimated Value: $328,000 - $365,000
3
Beds
2
Baths
1,084
Sq Ft
$323/Sq Ft
Est. Value
About This Home
This home is located at 1524 Elkhorn Dr, Cheyenne, WY 82007 and is currently estimated at $350,055, approximately $322 per square foot. 1524 Elkhorn Dr is a home located in Laramie County with nearby schools including Goins Elementary School, Johnson Junior High School, and South High School.
Ownership History
Date
Name
Owned For
Owner Type
Purchase Details
Closed on
May 3, 2021
Sold by
Pappion Anthony T and Pappion Helena
Bought by
Pappion Anthony T and Pappion Helena
Current Estimated Value
Home Financials for this Owner
Home Financials are based on the most recent Mortgage that was taken out on this home.
Original Mortgage
$90,000
Outstanding Balance
$81,306
Interest Rate
2.9%
Mortgage Type
VA
Estimated Equity
$268,749
Purchase Details
Closed on
Sep 8, 2011
Sold by
Hull Jason M
Bought by
Pappion Anthony T and Pappion Anthony T
Home Financials for this Owner
Home Financials are based on the most recent Mortgage that was taken out on this home.
Original Mortgage
$158,332
Interest Rate
4.34%
Mortgage Type
VA
Purchase Details
Closed on
Jun 3, 2005
Sold by
Heller Harold L and Heller Lavita D
Bought by
Hull Jason M
Home Financials for this Owner
Home Financials are based on the most recent Mortgage that was taken out on this home.
Original Mortgage
$150,160
Interest Rate
5.83%
Mortgage Type
VA
Create a Home Valuation Report for This Property
The Home Valuation Report is an in-depth analysis detailing your home's value as well as a comparison with similar homes in the area
Home Values in the Area
Average Home Value in this Area
Purchase History
| Date | Buyer | Sale Price | Title Company |
|---|---|---|---|
| Pappion Anthony T | -- | Boston National Title | |
| Pappion Anthony T | -- | None Available | |
| Hull Jason M | -- | -- |
Source: Public Records
Mortgage History
| Date | Status | Borrower | Loan Amount |
|---|---|---|---|
| Open | Pappion Anthony T | $90,000 | |
| Closed | Pappion Anthony T | $158,332 | |
| Previous Owner | Hull Jason M | $150,160 |
Source: Public Records
Tax History Compared to Growth
Tax History
| Year | Tax Paid | Tax Assessment Tax Assessment Total Assessment is a certain percentage of the fair market value that is determined by local assessors to be the total taxable value of land and additions on the property. | Land | Improvement |
|---|---|---|---|---|
| 2025 | $1,986 | $24,158 | $2,750 | $21,408 |
| 2024 | $1,986 | $31,090 | $3,667 | $27,423 |
| 2023 | $1,913 | $30,055 | $3,667 | $26,388 |
| 2022 | $1,716 | $26,780 | $3,667 | $23,113 |
| 2021 | $1,432 | $22,792 | $3,667 | $19,125 |
| 2020 | $1,344 | $21,633 | $3,667 | $17,966 |
| 2019 | $1,319 | $21,266 | $3,667 | $17,599 |
| 2018 | $1,079 | $18,091 | $2,708 | $15,383 |
| 2017 | $1,001 | $16,865 | $2,708 | $14,157 |
| 2016 | $912 | $15,630 | $2,637 | $12,993 |
| 2015 | $849 | $14,747 | $2,637 | $12,110 |
| 2014 | $831 | $14,436 | $2,637 | $11,799 |
Source: Public Records
Map
Nearby Homes
- 1600 Trail Way Rd
- 1717 W Allison Rd
- 1309 Ahrens Ave
- 1504 Woodward Dr
- 1800 Richard Martin Dr
- 1804 Richard Martin Dr
- 1808 Richard Martin Dr
- 1812 Richard Martin Dr
- 1712 Richard Martin Dr
- 1724 Richard Martin Dr
- TBD Wyott Dr
- 1621 Richard Martin Dr
- 1615 Alyssaelaine Dr
- 1532 Richard Martin Dr
- 125 King Ct
- 0 Hellwig Rd
- TBD W College Dr
- 205 Mccomb Ave
- 227 Hynds Ave
- 1210 Concerto Ln
- 1520 Elkhorn Dr
- 1600 Elkhorn Dr
- 1516 Elkhorn Dr
- 1718 Pinto Ln
- 1521 Elkhorn Dr
- 1717 Pinto Ln
- 1512 Elkhorn Dr
- 1517 Elkhorn Dr
- 1608 Elkhorn Dr
- 1712 Pinto Ln
- 1711 Pinto Ln
- 1718 Gold Dust Rd
- 1612 Elkhorn Dr
- 1508 Elkhorn Dr
- 1516 Ahrens Ave
- 1706 Pinto Ln
- 1707 Pinto Ln
- 1712 Gold Dust Rd
- 1809 Elkhorn Dr
- 1509 Elkhorn Dr