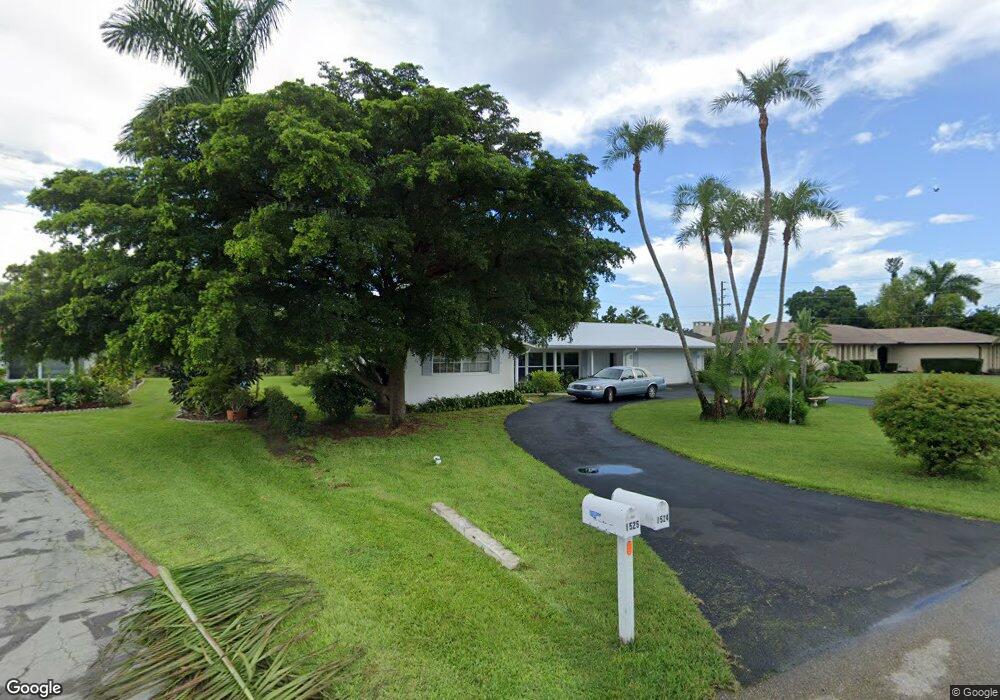
1524 Pinecrest Rd Fort Myers, FL 33919
Estimated Value: $374,058 - $447,000
2
Beds
2
Baths
2,418
Sq Ft
$169/Sq Ft
Est. Value
About This Home
This home is located at 1524 Pinecrest Rd, Fort Myers, FL 33919 and is currently estimated at $409,765, approximately $169 per square foot. 1524 Pinecrest Rd is a home located in Lee County with nearby schools including Orangewood Elementary School, Allen Park Elementary School, and Edison Park Creative & Expressive Arts School.
Ownership History
Date
Name
Owned For
Owner Type
Purchase Details
Closed on
Aug 8, 2013
Sold by
Flesner Jeffrey
Bought by
Flesner Jeffrey R and Medina Marta Monica
Current Estimated Value
Purchase Details
Closed on
Jun 30, 2006
Sold by
Flesner Jeffrey
Bought by
Flesner Jeffrey and Jeffrey Flesner Revocable Trust
Purchase Details
Closed on
Jun 3, 2004
Sold by
Taylor Lexie
Bought by
Flesner Jeffrey
Home Financials for this Owner
Home Financials are based on the most recent Mortgage that was taken out on this home.
Original Mortgage
$200,000
Outstanding Balance
$97,636
Interest Rate
5.98%
Mortgage Type
Seller Take Back
Estimated Equity
$312,129
Purchase Details
Closed on
May 25, 2000
Sold by
Hazlewood Phyllis T
Bought by
Taylor Lexie
Purchase Details
Closed on
Apr 5, 1999
Sold by
Taylor Orgus H
Bought by
Hazlewood Phyllis T
Create a Home Valuation Report for This Property
The Home Valuation Report is an in-depth analysis detailing your home's value as well as a comparison with similar homes in the area
Home Values in the Area
Average Home Value in this Area
Purchase History
| Date | Buyer | Sale Price | Title Company |
|---|---|---|---|
| Flesner Jeffrey R | -- | Attorney | |
| Flesner Jeffrey | -- | None Available | |
| Flesner Jeffrey | $235,000 | First Fidelity Title Inc | |
| Taylor Lexie | -- | -- | |
| Hazlewood Phyllis T | -- | -- |
Source: Public Records
Mortgage History
| Date | Status | Borrower | Loan Amount |
|---|---|---|---|
| Open | Flesner Jeffrey | $200,000 |
Source: Public Records
Tax History Compared to Growth
Tax History
| Year | Tax Paid | Tax Assessment Tax Assessment Total Assessment is a certain percentage of the fair market value that is determined by local assessors to be the total taxable value of land and additions on the property. | Land | Improvement |
|---|---|---|---|---|
| 2025 | $2,079 | $173,233 | -- | -- |
| 2024 | $2,017 | $168,351 | -- | -- |
| 2023 | $2,017 | $163,448 | $0 | $0 |
| 2022 | $2,083 | $158,687 | $0 | $0 |
| 2021 | $2,023 | $255,975 | $55,000 | $200,975 |
| 2020 | $2,010 | $151,938 | $0 | $0 |
| 2019 | $1,975 | $148,522 | $0 | $0 |
| 2018 | $1,974 | $145,753 | $0 | $0 |
| 2017 | $1,964 | $142,755 | $0 | $0 |
| 2016 | $1,950 | $211,550 | $55,000 | $156,550 |
| 2015 | $1,971 | $166,904 | $50,000 | $116,904 |
| 2014 | -- | $162,692 | $30,000 | $132,692 |
| 2013 | -- | $135,709 | $30,000 | $105,709 |
Source: Public Records
Map
Nearby Homes
- 13551 Stratford Place Cir Unit 202
- 13530 Stratford Place Cir Unit 104
- 13511 Stratford Place Cir Unit 302
- 13511 Stratford Place Cir Unit 305
- 1549 Braeburn Rd
- 6759 Winkler Rd
- 6765 Overlook Dr
- 14 Haverhill Ct Unit C
- 13353 Broadhurst Loop
- 13345 Broadhurst Loop
- 6779 Overlook Dr
- 120 Gledhill Ct
- 8740 Lueck Ln Unit 5
- 55 Laconia Ct
- 1500 Memoli Ln Unit B5
- 8407 S Haven Ln
- 1510 Memoli Ln Unit 2
- 13351 Greengate Blvd Unit 421
- 13405 Fox Chapel Ct
- 13192 Broadhurst Loop Unit C
- 1528 Pinecrest Rd
- 1520 Pinecrest Rd
- 1525 Pinecrest Rd
- 1532 Pinecrest Rd Unit 2
- 1507 Braeburn Rd
- 1531 Pinecrest Rd
- 1536 Pinecrest Rd
- 1514 Braeburn Rd
- 1535 Pinecrest Rd
- 1528 Braeburn Rd Unit 250
- 1513 Braeburn Rd
- 13540 Stratford Place Cir Unit 204
- 13540 Stratford Place Cir Unit 201
- 13540 Stratford Place Cir Unit 101
- 13540 Stratford Place Cir Unit 202
- 13540 Stratford Place Cir Unit 203
- 13540 Stratfrd Pl Cir Unit 104
- 13540 Stratfrd Pl Cir Unit 204
- 13540 Stratfrd Pl Cir Unit 203
- 13540 Stratfrd Pl Cir Unit 202