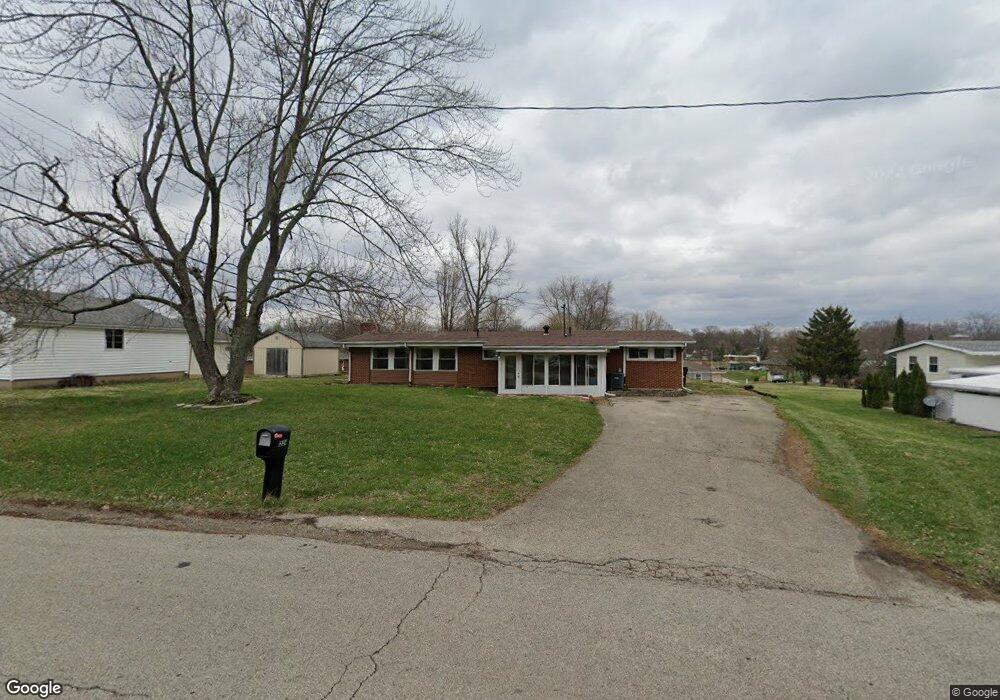
1524 Shadeland Dr Springfield, OH 45503
Estimated Value: $214,000 - $231,000
3
Beds
2
Baths
1,455
Sq Ft
$154/Sq Ft
Est. Value
About This Home
This home is located at 1524 Shadeland Dr, Springfield, OH 45503 and is currently estimated at $224,317, approximately $154 per square foot. 1524 Shadeland Dr is a home located in Clark County with nearby schools including Kenton Elementary School, Roosevelt Middle School, and Springfield High School.
Ownership History
Date
Name
Owned For
Owner Type
Purchase Details
Closed on
Apr 15, 2015
Sold by
Federal Home Loan Mortgage Corporation
Bought by
Taylor Lisa D
Current Estimated Value
Home Financials for this Owner
Home Financials are based on the most recent Mortgage that was taken out on this home.
Original Mortgage
$83,333
Outstanding Balance
$64,221
Interest Rate
3.77%
Mortgage Type
FHA
Estimated Equity
$160,096
Purchase Details
Closed on
Aug 18, 2014
Sold by
Small Steven
Bought by
Federal Home Loan Mortgage Corporation
Purchase Details
Closed on
May 2, 2012
Sold by
Smith Corlus L
Bought by
Small Steven H
Purchase Details
Closed on
Feb 29, 2000
Sold by
Mehoff Marsha K and Mehoff Marsha K
Bought by
Small Steven H and Small Corlus L
Home Financials for this Owner
Home Financials are based on the most recent Mortgage that was taken out on this home.
Original Mortgage
$71,775
Interest Rate
10.87%
Mortgage Type
Purchase Money Mortgage
Purchase Details
Closed on
Feb 3, 1992
Create a Home Valuation Report for This Property
The Home Valuation Report is an in-depth analysis detailing your home's value as well as a comparison with similar homes in the area
Home Values in the Area
Average Home Value in this Area
Purchase History
| Date | Buyer | Sale Price | Title Company |
|---|---|---|---|
| Taylor Lisa D | -- | Community First Title Agency | |
| Federal Home Loan Mortgage Corporation | $45,000 | Attorney | |
| Small Steven H | -- | Attorney | |
| Small Steven H | $95,700 | Ati Title Agency Of Ohio Inc | |
| -- | $68,600 | -- |
Source: Public Records
Mortgage History
| Date | Status | Borrower | Loan Amount |
|---|---|---|---|
| Open | Taylor Lisa D | $83,333 | |
| Previous Owner | Small Steven H | $71,775 |
Source: Public Records
Tax History Compared to Growth
Tax History
| Year | Tax Paid | Tax Assessment Tax Assessment Total Assessment is a certain percentage of the fair market value that is determined by local assessors to be the total taxable value of land and additions on the property. | Land | Improvement |
|---|---|---|---|---|
| 2024 | $2,341 | $48,400 | $11,210 | $37,190 |
| 2023 | $2,341 | $48,400 | $11,210 | $37,190 |
| 2022 | $2,398 | $48,400 | $11,210 | $37,190 |
| 2021 | $1,714 | $31,990 | $8,010 | $23,980 |
| 2020 | $1,718 | $31,990 | $8,010 | $23,980 |
| 2019 | $1,722 | $31,990 | $8,010 | $23,980 |
| 2018 | $1,729 | $30,770 | $8,570 | $22,200 |
| 2017 | $1,728 | $26,926 | $8,568 | $18,358 |
| 2016 | $1,730 | $26,926 | $8,568 | $18,358 |
| 2015 | $1,361 | $26,366 | $8,008 | $18,358 |
| 2014 | $1,356 | $26,366 | $8,008 | $18,358 |
| 2013 | $1,341 | $26,366 | $8,008 | $18,358 |
Source: Public Records
Map
Nearby Homes
- 1639 E Mile Rd
- 1535 Winding Trail
- The Siebert Plan at Magnolia Acres
- 1710 Mitchell Blvd
- 2124 Tavenner Ave
- 2541 Derr Rd
- 2344 Piney Branch Cir
- 2524 Home Orchard Dr
- 1316 Cedarview Dr W
- 1827 N Belmont Ave
- 26-28 N Belmont Ave
- 1811 Devon Dr
- 2408 Balsam Dr
- 2419 Gladden St
- 2683 Home Orchard Dr
- 1405 Hyannis Dr
- 2340 E Home Rd
- 2516 Balsam Dr
- 1506 Hyannis Dr
- 1020 Jasper St
- 1921 E Mile Rd
- 1532 Shadeland Dr
- 1910 Miracle Mile Unit 1912
- 1904 Miracle Mile
- 1927 E Mile Rd
- 1920 Miracle Mile Unit 1922
- 1503 Shadeland Dr
- 2000 Miracle Mile
- 1939 E Mile Rd
- 1608 Shadeland Dr
- 1926 E Mile Rd
- 1834 Miracle Mile
- 2002 Miracle Mile
- 1833 E Mile Rd
- 1609 Shadeland Dr
- 2009 E Mile Rd
- 1907 Miracle Mile
- 1929 Miracle Mile
- 1938 E Mile Rd
- 1618 Shadeland Dr