Estimated Value: $201,898 - $222,000
3
Beds
2
Baths
1,440
Sq Ft
$147/Sq Ft
Est. Value
About This Home
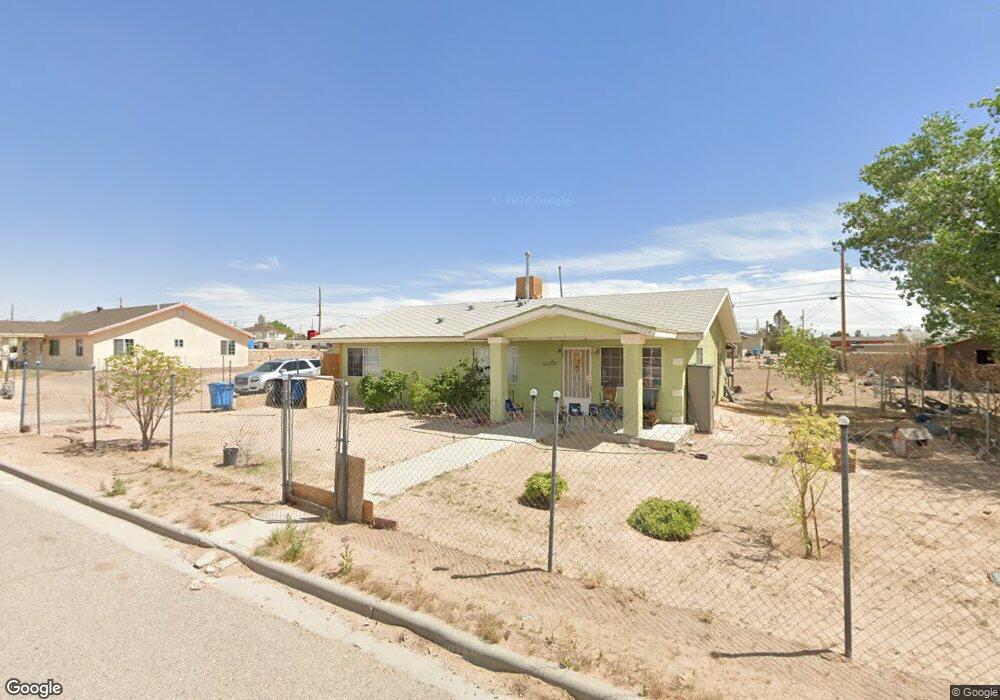
This home is located at 1524 W Bourne, Clint, TX 79836 and is currently estimated at $211,225, approximately $146 per square foot. 1524 W Bourne is a home located in El Paso County with nearby schools including William David Surratt Elementary School, Clint Junior High School, and Clint High School.
Ownership History
Date
Name
Owned For
Owner Type
Purchase Details
Closed on
Jan 28, 2015
Sold by
Srp Sub Llc
Bought by
Renteria Edwiges and Renteria Olga Lidia
Current Estimated Value
Home Financials for this Owner
Home Financials are based on the most recent Mortgage that was taken out on this home.
Original Mortgage
$60,287
Outstanding Balance
$48,951
Interest Rate
5.5%
Mortgage Type
FHA
Estimated Equity
$162,274
Purchase Details
Closed on
May 8, 2012
Sold by
Bank Of America Na
Bought by
Spt Real Estate Sub Iii Llc
Purchase Details
Closed on
Nov 1, 2011
Sold by
Chavarria Eva and Chavarria Carlos
Bought by
Bank Of America Na
Purchase Details
Closed on
Mar 22, 2007
Sold by
Lopez Esteban and Lopez Maria F
Bought by
Chavarria Eva
Home Financials for this Owner
Home Financials are based on the most recent Mortgage that was taken out on this home.
Original Mortgage
$88,000
Interest Rate
6.26%
Mortgage Type
Purchase Money Mortgage
Create a Home Valuation Report for This Property
The Home Valuation Report is an in-depth analysis detailing your home's value as well as a comparison with similar homes in the area
Home Values in the Area
Average Home Value in this Area
Purchase History
| Date | Buyer | Sale Price | Title Company |
|---|---|---|---|
| Renteria Edwiges | -- | None Available | |
| Spt Real Estate Sub Iii Llc | $48,300 | First American | |
| Bank Of America Na | $39,200 | Lsi Title Agency Inc | |
| Chavarria Eva | -- | None Available | |
| Lopez Esteban | -- | None Available |
Source: Public Records
Mortgage History
| Date | Status | Borrower | Loan Amount |
|---|---|---|---|
| Open | Renteria Edwiges | $60,287 | |
| Previous Owner | Chavarria Eva | $88,000 |
Source: Public Records
Tax History Compared to Growth
Tax History
| Year | Tax Paid | Tax Assessment Tax Assessment Total Assessment is a certain percentage of the fair market value that is determined by local assessors to be the total taxable value of land and additions on the property. | Land | Improvement |
|---|---|---|---|---|
| 2025 | $1,249 | $125,261 | -- | -- |
| 2024 | $1,249 | $113,874 | -- | -- |
| 2023 | $1,249 | $103,522 | $0 | $0 |
| 2022 | $2,224 | $94,111 | $0 | $0 |
| 2021 | $2,209 | $110,270 | $16,790 | $93,480 |
| 2020 | $1,910 | $77,777 | $16,790 | $60,987 |
| 2018 | $1,949 | $77,032 | $16,790 | $60,242 |
| 2017 | $1,863 | $74,144 | $14,447 | $59,697 |
| 2016 | $1,867 | $74,296 | $14,447 | $59,849 |
| 2015 | $2,404 | $97,297 | $14,447 | $82,850 |
| 2014 | $2,404 | $98,793 | $14,447 | $84,346 |
Source: Public Records
Map
Nearby Homes
- 1524 Wolsey
- 12601 N Loop Dr
- 12600 N Loop Dr
- 12801 N Loop Dr
- 12702 N Loop Dr
- 12703 N Loop Dr
- 140 Johnny Telles Dr
- 108 Johnny Telles Dr
- 181 Johnny Telles Dr
- 341 Roper Ln
- 320 Roper Ln
- 12449 Sugden Rd
- 2575 Darrington Rd
- 340 Roper Ln
- 440 Jaime Alvarado Ct
- 350 Roper Ln
- 190 Johnny Telles Dr
- 13325 Nacho Alvarado Ct
- 428 Jaime Alvarado Ct
- 13321 Nacho Alvarado Ct
- 1524 Westbourne Dr
- 1532 W Bourne
- 1516 W Bourne
- 1525 Fitzroy
- 1532 1532 Westbourn
- 1533 Fitzroy
- 1517 Fitzroy
- 1533 Westbourne Dr
- 1525 W Bourne
- 1540 W Bourne
- 1508 Westbourne Dr
- 1508 W Bourne
- 1517 W Bourne
- 1541 Fitzroy
- 1509 Westbourne Dr
- 1509 W Bourne
- 1524 Fitzroy Dr
- 1549 Fitzroy
- 1532 Fitzroy Dr
- 1501 W Bourne