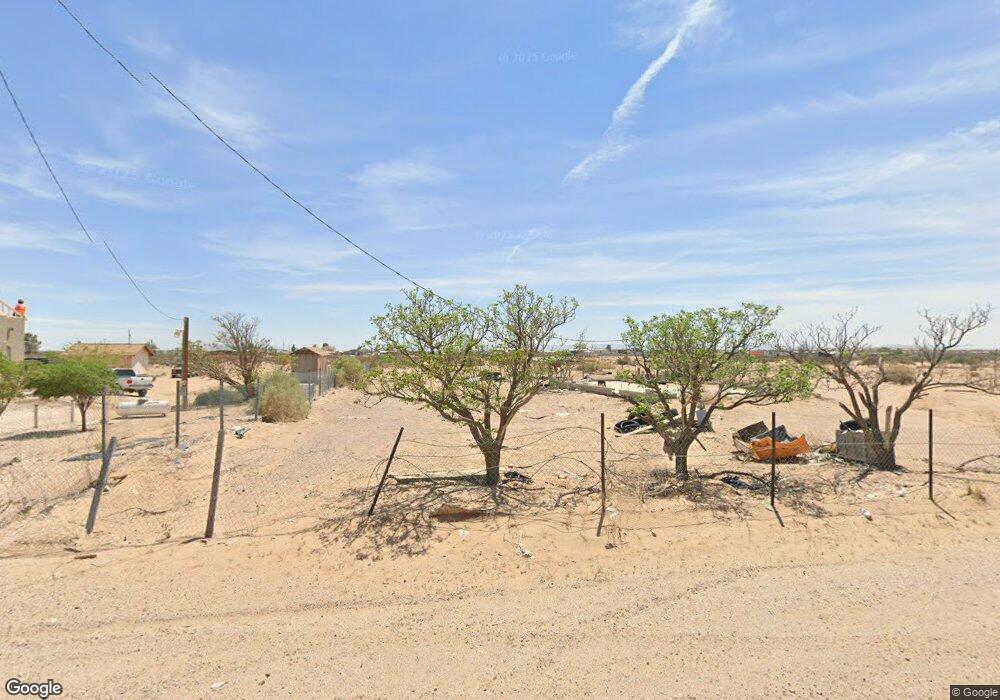
15240 Pumice Dr El Paso, TX 79928
Estimated Value: $67,099 - $203,000
--
Bed
1
Bath
729
Sq Ft
$191/Sq Ft
Est. Value
About This Home
This home is located at 15240 Pumice Dr, El Paso, TX 79928 and is currently estimated at $139,033, approximately $190 per square foot. 15240 Pumice Dr is a home located in El Paso County with nearby schools including William David Surratt Elementary School, Clint Junior High School, and Clint High School.
Ownership History
Date
Name
Owned For
Owner Type
Purchase Details
Closed on
May 2, 2018
Sold by
Perez Victor Manuel and Grapengesser Lavinia
Bought by
Santos Raymundo Carlos Lopez
Current Estimated Value
Purchase Details
Closed on
Apr 14, 2014
Sold by
Perez Elias and Perez Rosa Maria Araceli
Bought by
Lopez Santos Raymundo Carlos
Purchase Details
Closed on
Dec 2, 2011
Sold by
Perez Victor Manuel and Grapengiesser Lavinia
Bought by
Perez Elias and Perez Rosa Maria Araceli
Purchase Details
Closed on
Aug 15, 2011
Sold by
Perez Elias and Perez Rosa Maria Araceli
Bought by
Perez Victor Manuel and Grapengiesser Lavinia
Purchase Details
Closed on
Feb 3, 2010
Sold by
Gomez Pablo Garcia
Bought by
Perez Elias and Perez Rosa Maria Araceli
Purchase Details
Closed on
Jan 9, 2007
Sold by
Rodsky Family Lp
Bought by
Garcia Pablo
Create a Home Valuation Report for This Property
The Home Valuation Report is an in-depth analysis detailing your home's value as well as a comparison with similar homes in the area
Home Values in the Area
Average Home Value in this Area
Purchase History
| Date | Buyer | Sale Price | Title Company |
|---|---|---|---|
| Santos Raymundo Carlos Lopez | -- | None Available | |
| Lopez Santos Raymundo Carlos | -- | None Available | |
| Perez Elias | -- | None Available | |
| Perez Victor Manuel | -- | None Available | |
| Perez Elias | -- | None Available | |
| Garcia Pablo | -- | None Available |
Source: Public Records
Tax History Compared to Growth
Tax History
| Year | Tax Paid | Tax Assessment Tax Assessment Total Assessment is a certain percentage of the fair market value that is determined by local assessors to be the total taxable value of land and additions on the property. | Land | Improvement |
|---|---|---|---|---|
| 2025 | $849 | $42,878 | $38,336 | $4,542 |
| 2024 | $849 | $40,178 | $35,636 | $4,542 |
| 2023 | $878 | $40,178 | $35,636 | $4,542 |
| 2022 | $849 | $35,902 | $31,360 | $4,542 |
| 2021 | $891 | $34,508 | $30,647 | $3,861 |
| 2020 | $864 | $35,189 | $30,647 | $4,542 |
| 2018 | $890 | $35,189 | $30,647 | $4,542 |
| 2017 | $548 | $21,816 | $17,818 | $3,998 |
| 2016 | $548 | $21,816 | $17,818 | $3,998 |
| 2015 | $181 | $21,816 | $17,818 | $3,998 |
| 2014 | $181 | $7,458 | $3,460 | $3,998 |
Source: Public Records
Map
Nearby Homes
- 15001 Dairyland Ave
- PN-331881 Tbd
- PN-225950 Tbd
- PN-399643 Tbd
- 14900 Dairyland Ave
- 0 E El Paso Unit TX 79928
- PN- 374462 Mica Tbd Dr
- El paso Tbd
- 15030 Colonia Tierra Rd
- 15031 Colonia Campo Rd
- 39 Ascencion St
- 7668 Ascencion St
- 325 Ascencion St
- 0 Pisecson Ct
- 15540 Newkirk Rd
- 0 Kennemont Dr Unit 852189
- 15561 Newkirk Rd
- 15521 Stratford Rd
- 1 Sultan Rd
- TBD Borcula
- 15250 Pumice Dr
- 15241 Pumice Dr
- 15251 Pumice Dr
- 15220 Pumice Dr
- 15231 Pumice Dr
- 15210 Pumice Dr
- 15270 Pumice Dr
- 15211 Pumice Dr
- 15271 Tungsten Rd
- 15200 Pumice Dr
- 15240 Perlite Dr
- 15230 Tungsten Rd
- 15201 Pumice Dr
- 15220 Perlite Dr
- 15210 Tungsten Rd
- 15250 Perlite Dr
- 1 Red Cloud
- 15230 Perlite Dr
- 78 Tsp 4 Sec 13 T & P Abst 2084 W
- 15270 Tungsten