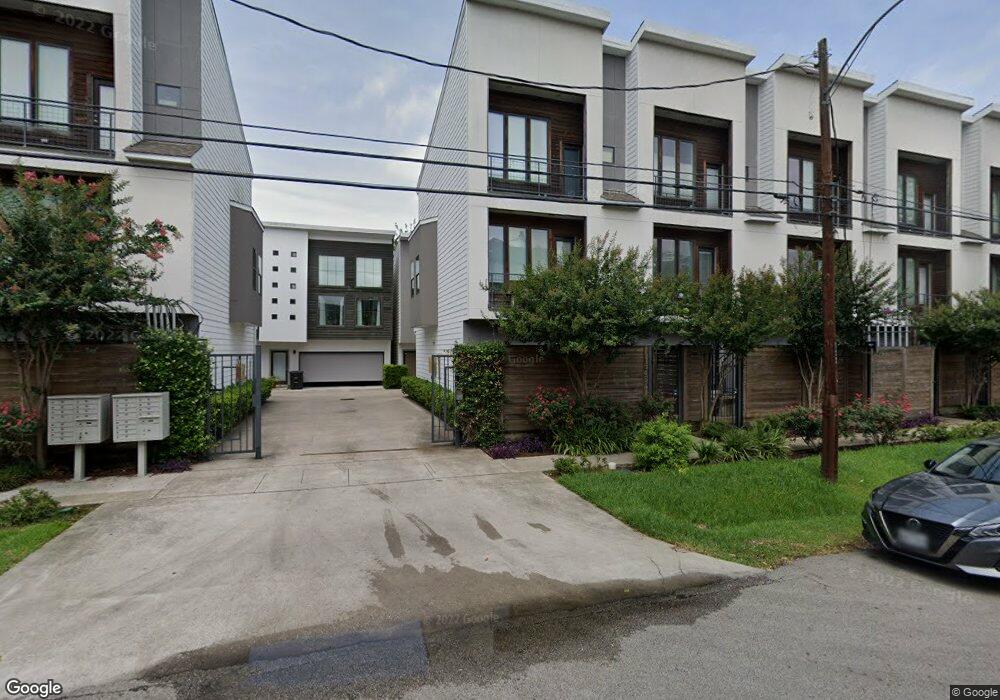
1525 Birdsall St Unit A Houston, TX 77007
Washington Avenue Coalition NeighborhoodEstimated Value: $343,064 - $406,000
2
Beds
2
Baths
1,401
Sq Ft
$265/Sq Ft
Est. Value
About This Home
This home is located at 1525 Birdsall St Unit A, Houston, TX 77007 and is currently estimated at $371,016, approximately $264 per square foot. 1525 Birdsall St Unit A is a home located in Harris County with nearby schools including Memorial Elementary School, Hogg Middle, and Lamar High School.
Ownership History
Date
Name
Owned For
Owner Type
Purchase Details
Closed on
Oct 23, 2020
Sold by
Clark Joshua J and Clark Taylor
Bought by
Austin John M and Austin Janet C
Current Estimated Value
Home Financials for this Owner
Home Financials are based on the most recent Mortgage that was taken out on this home.
Original Mortgage
$248,000
Outstanding Balance
$220,181
Interest Rate
2.8%
Mortgage Type
New Conventional
Estimated Equity
$150,835
Purchase Details
Closed on
Apr 10, 2017
Sold by
Franks Meghan and Franks Clay
Bought by
Clark Joshua J
Home Financials for this Owner
Home Financials are based on the most recent Mortgage that was taken out on this home.
Original Mortgage
$290,000
Interest Rate
4.16%
Mortgage Type
New Conventional
Purchase Details
Closed on
Jun 23, 2010
Sold by
Birdsall Group Lp
Bought by
Armbruster Meghan E
Home Financials for this Owner
Home Financials are based on the most recent Mortgage that was taken out on this home.
Original Mortgage
$182,000
Interest Rate
4.87%
Mortgage Type
New Conventional
Create a Home Valuation Report for This Property
The Home Valuation Report is an in-depth analysis detailing your home's value as well as a comparison with similar homes in the area
Home Values in the Area
Average Home Value in this Area
Purchase History
| Date | Buyer | Sale Price | Title Company |
|---|---|---|---|
| Austin John M | -- | Stewart Title | |
| Clark Joshua J | -- | None Available | |
| Armbruster Meghan E | -- | Fidelity National Title |
Source: Public Records
Mortgage History
| Date | Status | Borrower | Loan Amount |
|---|---|---|---|
| Open | Austin John M | $248,000 | |
| Previous Owner | Clark Joshua J | $290,000 | |
| Previous Owner | Armbruster Meghan E | $182,000 |
Source: Public Records
Tax History Compared to Growth
Tax History
| Year | Tax Paid | Tax Assessment Tax Assessment Total Assessment is a certain percentage of the fair market value that is determined by local assessors to be the total taxable value of land and additions on the property. | Land | Improvement |
|---|---|---|---|---|
| 2025 | $5,427 | $355,154 | $67,479 | $287,675 |
| 2024 | $5,427 | $311,000 | $59,090 | $251,910 |
| 2023 | $5,427 | $360,219 | $68,442 | $291,777 |
| 2022 | $6,752 | $306,663 | $58,266 | $248,397 |
| 2021 | $7,213 | $309,477 | $58,801 | $250,676 |
| 2020 | $7,100 | $293,178 | $55,704 | $237,474 |
| 2019 | $7,339 | $290,040 | $55,108 | $234,932 |
| 2018 | $5,599 | $290,040 | $55,108 | $234,932 |
| 2017 | $5,980 | $343,200 | $65,208 | $277,992 |
| 2016 | $5,437 | $343,200 | $65,208 | $277,992 |
| 2015 | $3,494 | $343,200 | $65,208 | $277,992 |
| 2014 | $3,494 | $293,384 | $55,743 | $237,641 |
Source: Public Records
Map
Nearby Homes
- 1510 Birdsall St
- 1506 Birdsall St
- 1632 Cohn St
- 5548 Nolda St
- 1636 Cohn St
- 1520 Malone St
- 1517 Asbury St
- 6005 Clyde St
- 6007 Tyne St Unit C
- 6018 Maxie St Unit B
- 6011 Maxie St
- 6021 Hamman St
- 1702 Utah St Unit B
- 1704 Utah St
- 6034 Maxie St
- 1308 Birdsall St
- 1410 Asbury St
- 1316 Malone St
- 1308 Cohn St
- 5340 Inker St Unit B
- 1525 Birdsall St Unit E
- 1525 Birdsall St Unit D
- 1525 Birdsall St Unit C
- 1525 Birdsall St Unit B
- 1525 Birdsall St Unit B
- 1525 Birdsall St Unit 1525E
- 1545 Birdsall St Unit B
- 1545 Birdsall St Unit D
- 1545 Birdsall St Unit E
- 1535 Birdsall St Unit D
- 1535 Birdsall St Unit E
- 1535 Birdsall St Unit B
- 1535 Birdsall St Unit A
- 1535 Birdsall St Unit C
- 1545 Birdsall St Unit C
- 1545 Birdsall St Unit A
- 1545 Birdsall St Unit 1545E
- 1519 Birdsall St
- 1507 Birdsall St
- 1517 Birdsall St