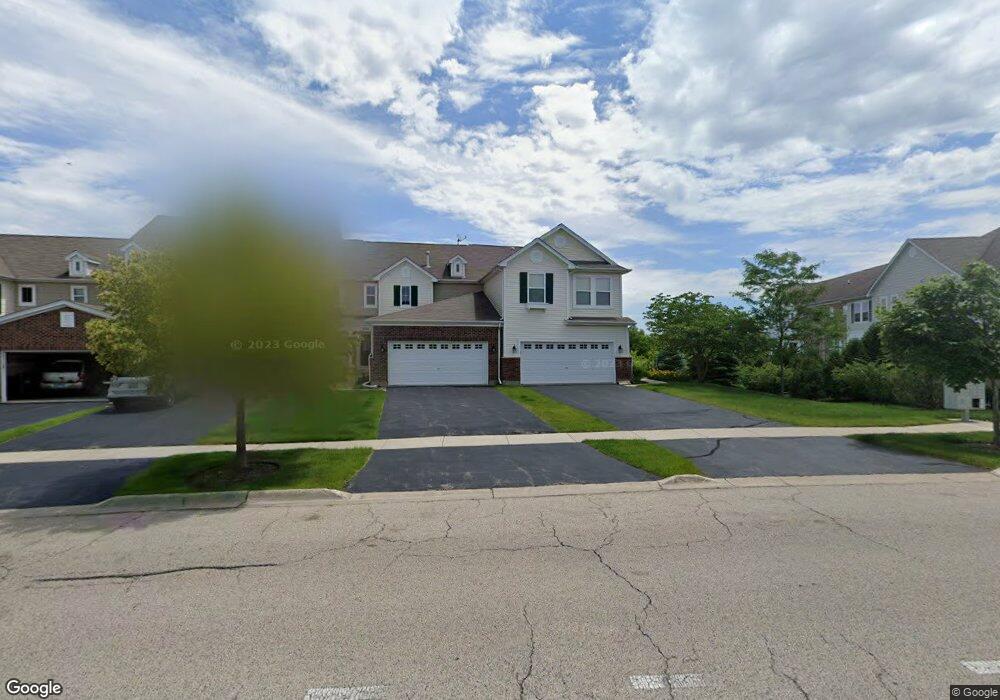
1525 Brompton Ln Crystal Lake, IL 60014
Estimated Value: $290,000 - $318,000
2
Beds
2
Baths
1,554
Sq Ft
$198/Sq Ft
Est. Value
About This Home
This home is located at 1525 Brompton Ln, Crystal Lake, IL 60014 and is currently estimated at $307,295, approximately $197 per square foot. 1525 Brompton Ln is a home located in McHenry County with nearby schools including Indian Prairie Elementary School, Lundahl Middle School, and Crystal Lake South High School.
Ownership History
Date
Name
Owned For
Owner Type
Purchase Details
Closed on
Jun 15, 2017
Sold by
Mae Fafnnie and Mortgage Association Federal National
Bought by
Abdullai Monika
Current Estimated Value
Home Financials for this Owner
Home Financials are based on the most recent Mortgage that was taken out on this home.
Original Mortgage
$131,900
Outstanding Balance
$109,803
Interest Rate
4.05%
Mortgage Type
New Conventional
Estimated Equity
$197,492
Purchase Details
Closed on
Sep 19, 2016
Sold by
Intercounty Judicial Sale S Corp
Bought by
Fannie Mae and Federal National Mortgage Association
Home Financials for this Owner
Home Financials are based on the most recent Mortgage that was taken out on this home.
Interest Rate
3.5%
Purchase Details
Closed on
Jul 21, 2008
Sold by
Kb Home Illinois Inc
Bought by
Murphy David
Home Financials for this Owner
Home Financials are based on the most recent Mortgage that was taken out on this home.
Original Mortgage
$141,494
Interest Rate
6.15%
Mortgage Type
Unknown
Create a Home Valuation Report for This Property
The Home Valuation Report is an in-depth analysis detailing your home's value as well as a comparison with similar homes in the area
Home Values in the Area
Average Home Value in this Area
Purchase History
| Date | Buyer | Sale Price | Title Company |
|---|---|---|---|
| Abdullai Monika | -- | First American Title | |
| Fannie Mae | -- | -- | |
| Murphy David | $176,868 | Cti |
Source: Public Records
Mortgage History
| Date | Status | Borrower | Loan Amount |
|---|---|---|---|
| Open | Abdullai Monika | $131,900 | |
| Previous Owner | Fannie Mae | -- | |
| Previous Owner | Murphy David | $141,494 |
Source: Public Records
Tax History Compared to Growth
Tax History
| Year | Tax Paid | Tax Assessment Tax Assessment Total Assessment is a certain percentage of the fair market value that is determined by local assessors to be the total taxable value of land and additions on the property. | Land | Improvement |
|---|---|---|---|---|
| 2024 | $7,451 | $88,009 | $17,757 | $70,252 |
| 2023 | $7,248 | $78,713 | $15,881 | $62,832 |
| 2022 | $6,234 | $65,811 | $16,192 | $49,619 |
| 2021 | $5,921 | $61,311 | $15,085 | $46,226 |
| 2020 | $5,786 | $59,141 | $14,551 | $44,590 |
| 2019 | $5,651 | $56,605 | $13,927 | $42,678 |
| 2018 | $5,117 | $50,239 | $12,866 | $37,373 |
| 2017 | $5,109 | $47,329 | $12,121 | $35,208 |
| 2016 | $4,329 | $44,390 | $11,368 | $33,022 |
| 2013 | -- | $43,676 | $10,605 | $33,071 |
Source: Public Records
Map
Nearby Homes
- 1421 Acadia Cir
- 1451 Acadia Cir
- 1441 Acadia Cir
- 1461 Acadia Cir
- 1549 Brompton Ln
- 1391 Acadia Cir
- 1668 Penn Ct Unit A
- 1549 Hollytree Ln Unit 2
- 1655 Kennsington Ln
- 1694 Penny Ln Unit A
- 1542 Candlewood Dr
- 1724 Hartford Ln
- 1644 Stockton Ln
- 1740 Bradford Ln
- 1420 Trailwood Dr
- 761 Village Rd
- 1644 Brigham Ln
- 1506 Monroe St
- 1823 Somerfield Ln
- 1323 Monroe St
- 1525 Brompton Ln Unit 184
- 1523 Brompton Ln
- 1523 Brompton Ln Unit 185
- 1527 Brompton Ln
- 1527 Brompton Ln Unit 183
- 1521 Brompton Ln
- 1519 Brompton Ln
- 664 Grand Canyon Cir
- 662 Grand Canyon Cir
- 660 Grand Canyon Cir
- 658 Grand Canyon Cir
- 1520 Brompton Ln
- 1520 Brompton Ln Unit 85
- 668 Acadia Cir
- 668 Acadia Cir Unit 86
- 1518 Brompton Ln
- 656 Grand Canyon Cir
- 1516 Brompton Ln
- 1516 Brompton Ln Unit 83
- 1524 Glacier Cir