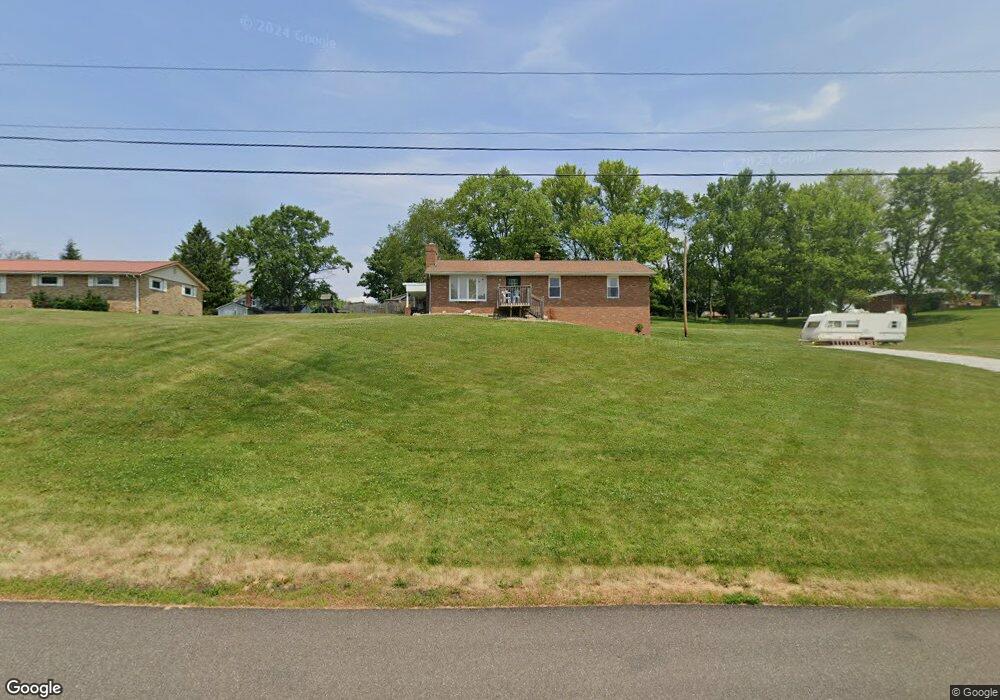
1525 Bywood St SE Canton, OH 44707
Estimated Value: $244,016 - $273,000
3
Beds
2
Baths
2,194
Sq Ft
$119/Sq Ft
Est. Value
About This Home
This home is located at 1525 Bywood St SE, Canton, OH 44707 and is currently estimated at $261,754, approximately $119 per square foot. 1525 Bywood St SE is a home located in Stark County with nearby schools including Faircrest Memorial Elementary School, Canton South High School, and Beacon Academy.
Ownership History
Date
Name
Owned For
Owner Type
Purchase Details
Closed on
Jun 11, 2025
Sold by
Inspira Financial Trust Llc and Lewis John L
Bought by
May Michael W
Current Estimated Value
Home Financials for this Owner
Home Financials are based on the most recent Mortgage that was taken out on this home.
Original Mortgage
$257,254
Outstanding Balance
$255,720
Interest Rate
6.76%
Mortgage Type
FHA
Estimated Equity
$6,034
Purchase Details
Closed on
Jan 13, 2020
Sold by
Joiner Edwin R
Bought by
Quest Trust Co
Purchase Details
Closed on
Apr 29, 2010
Sold by
Deluca Michelle J
Bought by
Us Bank National Association
Purchase Details
Closed on
Oct 4, 2002
Sold by
Viola Joseph and Viola Lucinda L
Bought by
Deluca Rock K and Deluca Michelle J
Home Financials for this Owner
Home Financials are based on the most recent Mortgage that was taken out on this home.
Original Mortgage
$113,000
Interest Rate
7%
Mortgage Type
Purchase Money Mortgage
Create a Home Valuation Report for This Property
The Home Valuation Report is an in-depth analysis detailing your home's value as well as a comparison with similar homes in the area
Home Values in the Area
Average Home Value in this Area
Purchase History
| Date | Buyer | Sale Price | Title Company |
|---|---|---|---|
| May Michael W | $262,000 | None Listed On Document | |
| Quest Trust Co | $71,500 | None Available | |
| Us Bank National Association | $96,000 | None Available | |
| Deluca Rock K | $120,000 | -- |
Source: Public Records
Mortgage History
| Date | Status | Borrower | Loan Amount |
|---|---|---|---|
| Open | May Michael W | $257,254 | |
| Previous Owner | Deluca Rock K | $113,000 |
Source: Public Records
Tax History Compared to Growth
Tax History
| Year | Tax Paid | Tax Assessment Tax Assessment Total Assessment is a certain percentage of the fair market value that is determined by local assessors to be the total taxable value of land and additions on the property. | Land | Improvement |
|---|---|---|---|---|
| 2025 | $0 | $77,950 | $20,510 | $57,440 |
| 2024 | -- | $77,950 | $20,510 | $57,440 |
| 2023 | $2,891 | $62,230 | $13,790 | $48,440 |
| 2022 | $2,685 | $62,230 | $13,790 | $48,440 |
| 2021 | $2,230 | $51,450 | $13,790 | $37,660 |
| 2020 | $1,840 | $44,210 | $11,690 | $32,520 |
| 2019 | $939 | $44,210 | $11,690 | $32,520 |
| 2018 | $2,200 | $44,210 | $11,690 | $32,520 |
| 2017 | $1,871 | $35,390 | $15,370 | $20,020 |
| 2016 | $1,875 | $35,390 | $15,370 | $20,020 |
| 2015 | $1,878 | $35,390 | $15,370 | $20,020 |
| 2014 | $1,748 | $30,800 | $13,370 | $17,430 |
| 2013 | $879 | $30,800 | $13,370 | $17,430 |
Source: Public Records
Map
Nearby Homes
- 634 Figueroa Place SE
- 223 Faircrest St SW
- 207 51st St SW
- 4805 Harvest Cir SE
- 5346 Shaker Valley Cir SE
- 5139 Derby Cir SE
- 1611 Village St SE
- 5327 Dunfred Cir SE
- 5333 Dunfred Cir SE
- 1926 Village St SE
- 3673 Highview Ave SW
- 3415 Cleveland Ave SW
- 132 33rd St SE
- 340 53rd St SW
- 502 Fohl St SW
- 5226 Ashmont Ave SW
- 236 32nd St SW
- 711 Somerset Ave SW
- 900 53rd St SW
- 000 53rd St SW
- 1515 Bywood St SE
- 1508 Faircrest St SE
- 1619 Bywood St SE
- 1518 Bywood St SE
- 1600 Bywood St SE
- 1622 Faircrest St SE
- 1624 Bywood St SE
- 1631 Bywood St SE
- 1632 Faircrest St SE
- 1415 Bywood St SE
- 1420 Bywood St SE
- 1521 Faircrest St SE
- 1418 Faircrest St SE
- 1643 Bywood St SE
- 1505 Faircrest St SE
- 1623 Faircrest St SE
- 1644 Faircrest St SE
- 1429 Faircrest St SE
- 1605 Faircrest St SE
- 1412 Faircrest St SE