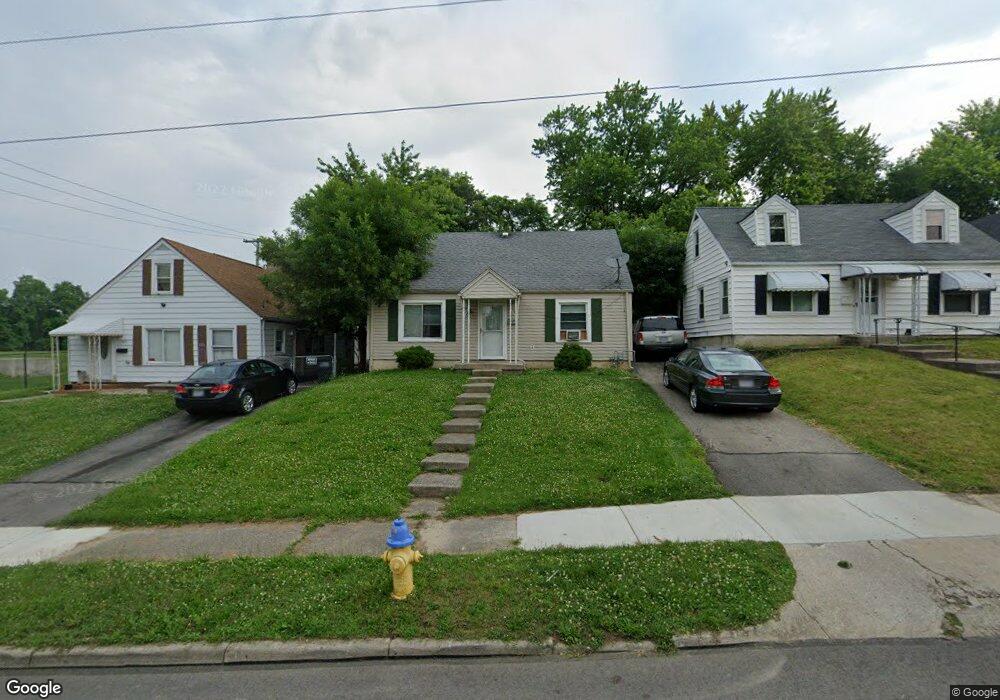
1525 Darst Ave Dayton, OH 45403
Wright View NeighborhoodEstimated Value: $110,136 - $151,000
3
Beds
1
Bath
1,389
Sq Ft
$95/Sq Ft
Est. Value
About This Home
This home is located at 1525 Darst Ave, Dayton, OH 45403 and is currently estimated at $132,034, approximately $95 per square foot. 1525 Darst Ave is a home located in Montgomery County with nearby schools including Ruskin Elementary School, Kiser Elementary, and Horizon Science Academy Dayton Downtown.
Ownership History
Date
Name
Owned For
Owner Type
Purchase Details
Closed on
Dec 16, 2016
Sold by
Hunt William S and Hunt Robin L
Bought by
Ramirez Juan M
Current Estimated Value
Purchase Details
Closed on
Sep 23, 2010
Sold by
Secretary Of Housing & Urban Development
Bought by
Hunt William S and Hunt Robin L
Purchase Details
Closed on
Feb 16, 2010
Sold by
Pnc Mortgage
Bought by
The Secretary Of The Department Of Housi
Purchase Details
Closed on
Feb 8, 2010
Sold by
Thomason Kristin N and Massie Kristin N
Bought by
Pnc Mortgage
Purchase Details
Closed on
Nov 27, 2001
Sold by
Short Marion
Bought by
Massie Kristin N
Home Financials for this Owner
Home Financials are based on the most recent Mortgage that was taken out on this home.
Original Mortgage
$66,358
Interest Rate
6.52%
Mortgage Type
FHA
Purchase Details
Closed on
Sep 28, 1999
Sold by
Davis Mary H
Bought by
Short Marion
Create a Home Valuation Report for This Property
The Home Valuation Report is an in-depth analysis detailing your home's value as well as a comparison with similar homes in the area
Home Values in the Area
Average Home Value in this Area
Purchase History
| Date | Buyer | Sale Price | Title Company |
|---|---|---|---|
| Ramirez Juan M | $18,000 | Vantage Land Title | |
| Hunt William S | $27,010 | Attorney | |
| The Secretary Of The Department Of Housi | -- | Attorney | |
| Pnc Mortgage | $40,000 | Attorney | |
| Massie Kristin N | $67,400 | -- | |
| Short Marion | $60,000 | -- |
Source: Public Records
Mortgage History
| Date | Status | Borrower | Loan Amount |
|---|---|---|---|
| Previous Owner | Massie Kristin N | $66,358 |
Source: Public Records
Tax History Compared to Growth
Tax History
| Year | Tax Paid | Tax Assessment Tax Assessment Total Assessment is a certain percentage of the fair market value that is determined by local assessors to be the total taxable value of land and additions on the property. | Land | Improvement |
|---|---|---|---|---|
| 2024 | $1,355 | $23,360 | $3,890 | $19,470 |
| 2023 | $1,355 | $23,360 | $3,890 | $19,470 |
| 2022 | $1,403 | $18,720 | $3,110 | $15,610 |
| 2021 | $1,395 | $18,720 | $3,110 | $15,610 |
| 2020 | $1,392 | $18,720 | $3,110 | $15,610 |
| 2019 | $1,262 | $15,160 | $4,070 | $11,090 |
| 2018 | $1,264 | $15,160 | $4,070 | $11,090 |
| 2017 | $1,255 | $15,160 | $4,070 | $11,090 |
| 2016 | $1,399 | $16,130 | $4,430 | $11,700 |
| 2015 | $1,324 | $16,130 | $4,430 | $11,700 |
| 2014 | $1,324 | $16,130 | $4,430 | $11,700 |
| 2012 | -- | $21,430 | $6,220 | $15,210 |
Source: Public Records
Map
Nearby Homes
- 404 S Smithville Rd
- 520 S Smithville Rd
- 1626 Darst Ave
- 515 Heiss Ave Unit 515-517
- 1614 Huffman Ave Unit 1612
- 1629 Suman Ave
- 1730 Darst Ave
- 715 Gondert Ave
- 1620 Gondert Ave Unit 1618
- 1620 Gondert Ave
- 1323 Huffman Ave
- 420 Dawnview Ave
- 631 Greenlawn Ave
- 1800 Darst Ave
- 1714 Gondert Ave
- 1815 Huffman Ave
- 763 Greenlawn Ave
- 223 Pleasant Ave
- 101 S Delmar Ave
- 4856 Airway Rd
- 1521 Darst Ave
- 1529 Darst Ave
- 1533 Darst Ave
- 1537 Darst Ave
- 1520 Speice Ave
- 1520 Speice Ave
- 1516 Darst Ave
- 1541 Darst Ave
- 1526 Darst Ave
- 1530 Darst Ave
- 1510 Darst Ave
- 1536 Darst Ave
- 1500 Darst Ave
- 1542 Darst Ave
- 1482 Darst Ave
- 1519 Huffman Ave
- 1525 Huffman Ave
- 421 S Smithville Rd
- 1517 Huffman Ave
- 1529 Huffman Ave