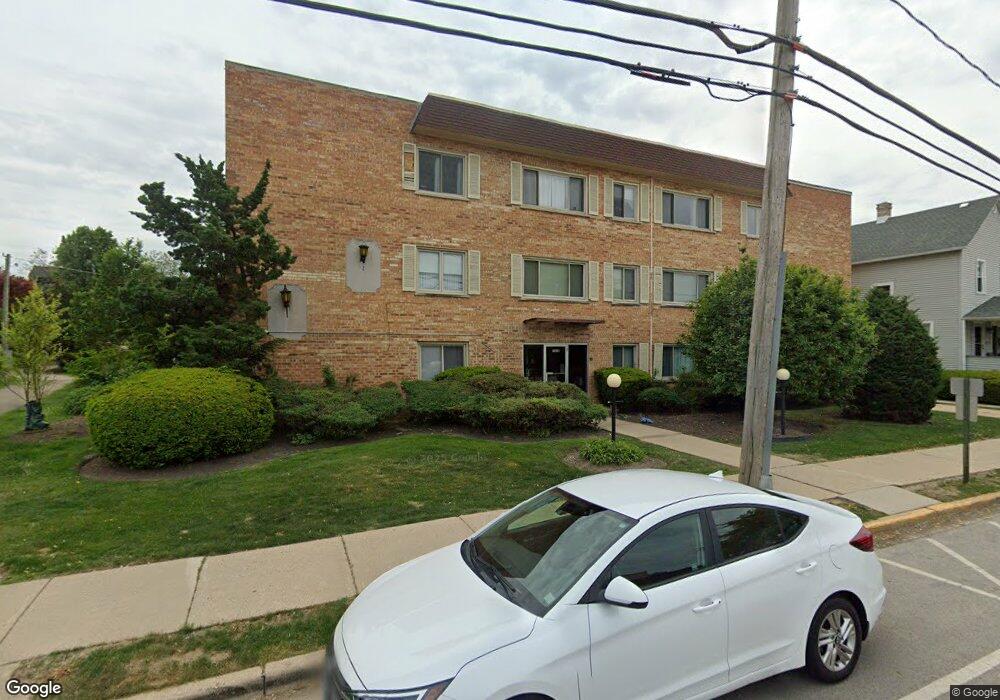
1525 E Thacker St Unit 1C Des Plaines, IL 60016
Estimated Value: $200,000 - $226,000
2
Beds
2
Baths
1,000
Sq Ft
$211/Sq Ft
Est. Value
About This Home
This home is located at 1525 E Thacker St Unit 1C, Des Plaines, IL 60016 and is currently estimated at $211,262, approximately $211 per square foot. 1525 E Thacker St Unit 1C is a home located in Cook County with nearby schools including Central Elementary School, Chippewa Middle School, and Maine West High School.
Ownership History
Date
Name
Owned For
Owner Type
Purchase Details
Closed on
Oct 13, 2022
Sold by
Gudden Thomas and Gudden Carrie
Bought by
Grandinetti Felice
Current Estimated Value
Home Financials for this Owner
Home Financials are based on the most recent Mortgage that was taken out on this home.
Original Mortgage
$10,000
Outstanding Balance
$7,462
Interest Rate
6.09%
Estimated Equity
$203,800
Purchase Details
Closed on
Aug 26, 2004
Sold by
Mackie Zeljko and Mackie Vesna
Bought by
Gudden Thomas
Purchase Details
Closed on
Jul 29, 1999
Sold by
Varjavandi Sandra and Leone Vickers Living Trust
Bought by
Mackic Zeljko and Mackic Vesna
Home Financials for this Owner
Home Financials are based on the most recent Mortgage that was taken out on this home.
Original Mortgage
$93,120
Interest Rate
8.21%
Purchase Details
Closed on
Sep 2, 1997
Sold by
Vickers Leone
Bought by
Vickers Leone and Trust #9297
Create a Home Valuation Report for This Property
The Home Valuation Report is an in-depth analysis detailing your home's value as well as a comparison with similar homes in the area
Home Values in the Area
Average Home Value in this Area
Purchase History
| Date | Buyer | Sale Price | Title Company |
|---|---|---|---|
| Grandinetti Felice | -- | None Listed On Document | |
| Gudden Thomas | $165,000 | Rtc | |
| Mackic Zeljko | $96,000 | Professional National Title | |
| Vickers Leone | -- | -- |
Source: Public Records
Mortgage History
| Date | Status | Borrower | Loan Amount |
|---|---|---|---|
| Open | Grandinetti Felice | $10,000 | |
| Open | Grandinetti Felice | $134,000 | |
| Previous Owner | Mackic Zeljko | $93,120 |
Source: Public Records
Tax History
| Year | Tax Paid | Tax Assessment Tax Assessment Total Assessment is a certain percentage of the fair market value that is determined by local assessors to be the total taxable value of land and additions on the property. | Land | Improvement |
|---|---|---|---|---|
| 2025 | $3,784 | $18,452 | $810 | $17,642 |
| 2024 | $3,784 | $14,353 | $720 | $13,633 |
| 2023 | $2,813 | $14,353 | $720 | $13,633 |
| 2022 | $2,813 | $14,353 | $720 | $13,633 |
| 2021 | $2,485 | $11,415 | $585 | $10,830 |
| 2020 | $3,450 | $11,415 | $585 | $10,830 |
| 2019 | $3,901 | $14,497 | $585 | $13,912 |
| 2018 | $2,590 | $8,662 | $517 | $8,145 |
| 2017 | $2,545 | $8,662 | $517 | $8,145 |
| 2016 | $2,407 | $8,662 | $517 | $8,145 |
| 2015 | $2,698 | $8,925 | $450 | $8,475 |
| 2014 | $2,641 | $8,925 | $450 | $8,475 |
| 2013 | $2,575 | $8,925 | $450 | $8,475 |
Source: Public Records
Map
Nearby Homes
- 1551 Ashland Ave Unit 306
- 835 Pearson St Unit 308
- 1524 Oakwood Ave
- 1600 E Thacker St Unit 513
- 1636 Ashland Ave Unit 402
- 905 Center St Unit B208
- 770 Pearson St Unit 808
- 1638 Oakwood Ave
- 1649 Ashland Ave Unit 501
- 830 Center St
- 750 Pearson St Unit 904
- 821 Lexington Cir E
- 900 Center St Unit 3A
- 1380 Oakwood Ave Unit 306
- 711 S River Rd Unit 617
- 711 S River Rd Unit 704
- 1630 Henry Ave
- 787 Graceland Ave Unit 202B
- 1277 E Thacker St Unit 303
- 1685 Mill St Unit 409
- 1525 E Thacker St Unit 3A
- 1525 E Thacker St Unit 2F
- 1525 E Thacker St Unit 2B
- 1525 E Thacker St Unit 1D
- 1525 E Thacker St Unit 3F
- 1525 E Thacker St Unit 1B
- 1525 E Thacker St Unit 2D
- 1525 E Thacker St Unit 2A
- 1525 E Thacker St Unit 3E
- 1525 E Thacker St Unit 3D
- 1525 E Thacker St Unit 2E
- 1525 E Thacker St Unit 2C
- 1525 E Thacker St Unit 3C
- 1525 E Thacker St Unit 3B
- 1509 E Thacker St
- 1503 E Thacker St
- 1522 Ashland Ave
- 1518 Ashland Ave
- 931 S Cora St
- 936 S Cora St
Your Personal Tour Guide
Ask me questions while you tour the home.