1525 Sander Ct Unit 101 Wheeling, IL 60090
Estimated Value: $204,537 - $229,000
2
Beds
--
Bath
77,088
Sq Ft
$3/Sq Ft
Est. Value
About This Home
This home is located at 1525 Sander Ct Unit 101, Wheeling, IL 60090 and is currently estimated at $218,634, approximately $2 per square foot. 1525 Sander Ct Unit 101 is a home located in Cook County with nearby schools including Dwight D Eisenhower Elementary School, Anne Sullivan Elementary School, and Betsy Ross Elementary School.
Ownership History
Date
Name
Owned For
Owner Type
Purchase Details
Closed on
Jun 23, 2016
Sold by
Miroslaw Sieniecki
Bought by
Sultanovska Svitlana
Current Estimated Value
Home Financials for this Owner
Home Financials are based on the most recent Mortgage that was taken out on this home.
Original Mortgage
$93,750
Outstanding Balance
$73,980
Interest Rate
3.56%
Estimated Equity
$144,654
Purchase Details
Closed on
May 23, 2014
Sold by
Shkarovsky Igor and Shkarovsky Inna
Bought by
Rigo I Llc Series A
Purchase Details
Closed on
Feb 8, 2006
Sold by
Inna Shkarovsky Igor and Inna Shkarovskaia
Bought by
Shkarovsky Igor and Shkarovsky Inna
Purchase Details
Closed on
Sep 12, 2000
Sold by
Klor Louis D and Klor Barry M
Bought by
Inna Shkarovsky Igor and Inna Shkarovskaia
Home Financials for this Owner
Home Financials are based on the most recent Mortgage that was taken out on this home.
Original Mortgage
$55,000
Interest Rate
7.98%
Create a Home Valuation Report for This Property
The Home Valuation Report is an in-depth analysis detailing your home's value as well as a comparison with similar homes in the area
Home Values in the Area
Average Home Value in this Area
Purchase History
| Date | Buyer | Sale Price | Title Company |
|---|---|---|---|
| Sultanovska Svitlana | -- | -- | |
| Rigo I Llc Series A | -- | None Available | |
| Shkarovsky Igor | -- | None Available | |
| Inna Shkarovsky Igor | $110,000 | -- |
Source: Public Records
Mortgage History
| Date | Status | Borrower | Loan Amount |
|---|---|---|---|
| Open | Sultanovska Svitlana | $93,750 | |
| Closed | Sultanovska Svitlana | -- | |
| Previous Owner | Inna Shkarovsky Igor | $55,000 |
Source: Public Records
Tax History
| Year | Tax Paid | Tax Assessment Tax Assessment Total Assessment is a certain percentage of the fair market value that is determined by local assessors to be the total taxable value of land and additions on the property. | Land | Improvement |
|---|---|---|---|---|
| 2025 | $2,948 | $16,012 | $584 | $15,428 |
| 2024 | $2,948 | $13,242 | $494 | $12,748 |
| 2023 | $2,792 | $13,242 | $494 | $12,748 |
| 2022 | $2,792 | $13,242 | $494 | $12,748 |
| 2021 | $2,315 | $10,323 | $337 | $9,986 |
| 2020 | $2,325 | $10,323 | $337 | $9,986 |
| 2019 | $2,339 | $11,522 | $337 | $11,185 |
| 2018 | $1,220 | $7,291 | $292 | $6,999 |
| 2017 | $1,222 | $7,291 | $292 | $6,999 |
| 2016 | $1,391 | $7,291 | $292 | $6,999 |
| 2015 | $1,375 | $6,972 | $258 | $6,714 |
| 2014 | $1,360 | $6,972 | $258 | $6,714 |
| 2013 | $1,298 | $6,972 | $258 | $6,714 |
Source: Public Records
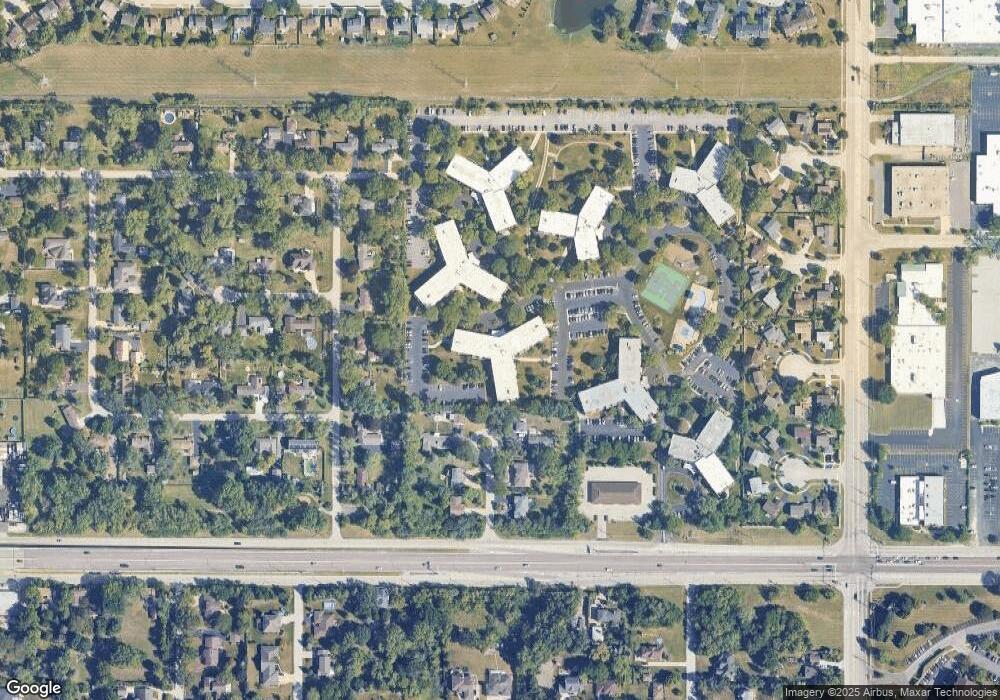
Map
Nearby Homes
- 1525 Sander Ct Unit 113
- 1550 Sandpebble Dr Unit 209
- 1450 Sandpebble Dr Unit 333
- 1430 Sandstone Dr Unit 202
- 523 Bridle Trail Unit 161
- 448 Bridle Trail Unit 211
- 802 Andover Ct
- 1201 Pleasant Run Dr Unit 312
- 1125 Pleasant Run Dr Unit 807
- 1111 Pleasant Run Dr Unit 911
- 13 W Kenilworth Ave
- 988 Ridgefield Ln Unit 54
- 307 Anne Ct
- 1105 N Maple Ln
- 42 Cherbourg Ct Unit 492714
- 1033 Wheeling Rd
- 200 Violet Ln
- 200 N Pine St
- 751 Garth Rd
- 15 E Willow Rd
- 1525 Sander Ct Unit 205
- 1525 Sander Ct Unit 307
- 1525 Sander Ct Unit 318
- 1525 Sander Ct Unit 105
- 1525 Sander Ct Unit 208
- 1525 Sander Ct Unit 207
- 1525 Sander Ct Unit 309
- 1525 Sander Ct Unit 213
- 1525 Sander Ct Unit 118
- 1525 Sander Ct Unit 108
- 1525 Sander Ct Unit 316
- 1525 Sander Ct Unit 218
- 1525 Sander Ct Unit 312
- 1525 Sander Ct Unit 206
- 1525 Sander Ct Unit 301
- 1525 Sander Ct Unit 107
- 1525 Sander Ct Unit 209
- 1525 Sander Ct Unit 314
- 1525 Sander Ct Unit 306
- 1525 Sander Ct Unit 305
Your Personal Tour Guide
Ask me questions while you tour the home.