
Seller's Agent in 2019
Sharon Watson
RE/MAX
(541) 956-5518
133 Total Sales
Estimated Value: $313,000 - $319,640
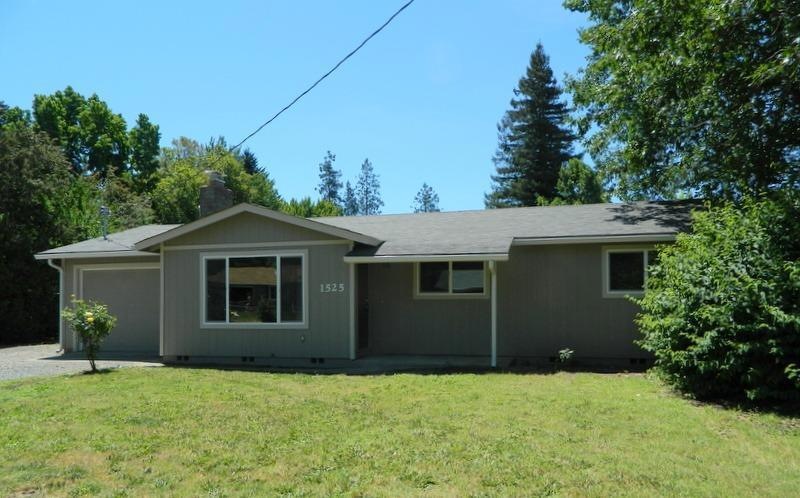
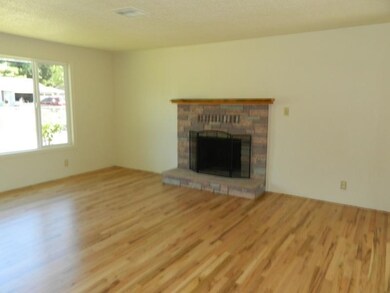
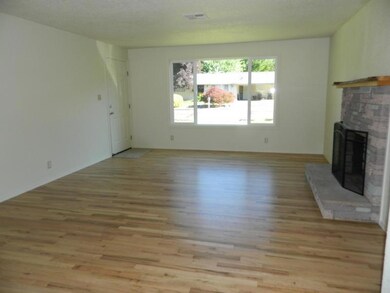
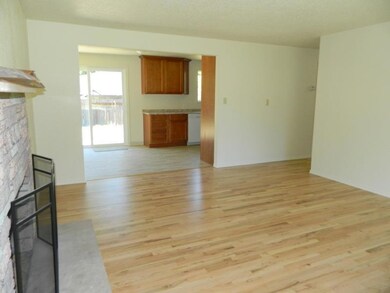
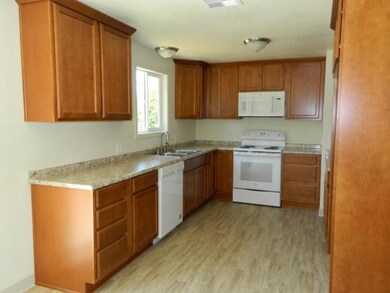
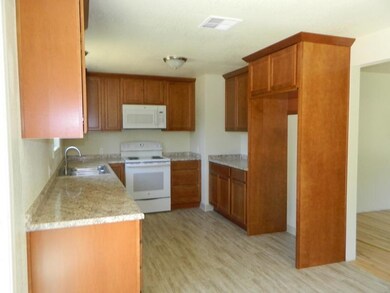
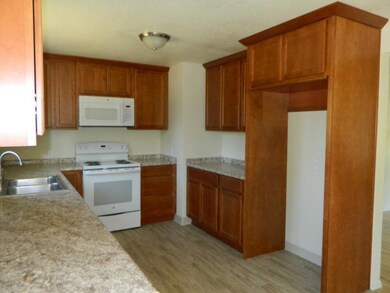
Move in Ready. Just remodeled and updated. New everything. 3 bdrm 1 bath 1020 sqft. Lovely refinished red oak flooring in living room and 3 bedrooms. Fireplace in Living room, new kitchen appliances, new cabinets, new counter tops and floor, New Vinyl windows, New siding, New Paint interior and exterior, Bathroom has new vanity and toilet and flooring. Single car garage, Large Fenced backyard, Off street parking.
Last Agent to Sell the Property
RE/MAX Integrity Grants Pass License #780303623 Listed on: 06/25/2019
| Date | Buyer | Sale Price | Title Company |
|---|---|---|---|
| Ternosky Michael | $239,900 | First American |
| Date | Status | Borrower | Loan Amount |
|---|---|---|---|
| Open | Ternosky Michael | $239,900 |
| Date | Event | Price | List to Sale | Price per Sq Ft |
|---|---|---|---|---|
| 08/27/2019 08/27/19 | Sold | $239,900 | 0.0% | $235 / Sq Ft |
| 07/20/2019 07/20/19 | Pending | -- | -- | -- |
| 06/17/2019 06/17/19 | For Sale | $240,000 | -- | $235 / Sq Ft |
| Year | Tax Paid | Tax Assessment Tax Assessment Total Assessment is a certain percentage of the fair market value that is determined by local assessors to be the total taxable value of land and additions on the property. | Land | Improvement |
|---|---|---|---|---|
| 2025 | $1,471 | $113,280 | -- | -- |
| 2024 | $1,471 | $109,990 | -- | -- |
| 2023 | $1,386 | $106,800 | $0 | $0 |
| 2022 | $1,392 | $103,690 | -- | -- |
| 2021 | $1,308 | $100,670 | $0 | $0 |
| 2020 | $1,270 | $97,750 | $0 | $0 |
| 2019 | $1,409 | $108,450 | $0 | $0 |
| 2018 | $1,434 | $105,300 | $0 | $0 |
| 2017 | $1,424 | $102,240 | $0 | $0 |
| 2016 | $1,252 | $99,270 | $0 | $0 |
| 2015 | $1,211 | $96,380 | $0 | $0 |
| 2014 | $1,178 | $93,580 | $0 | $0 |
Seller's Agent in 2019
Sharon Watson
RE/MAX
(541) 956-5518
133 Total Sales
D
Buyer's Agent in 2019
Dan Heeater
John L Scott Real Estate Grants Pass
(541) 441-1391
54 Total Sales
Source: Oregon Datashare
MLS Number: 103003231
APN: R311630
Disclaimer: Certain information contained herein is derived from information provided by parties other than Homes.com. All information provided is deemed reliable, but is not guaranteed to be accurate and should be independently verified.
![]() © 2025 Oregon Datashare (KCAR | MLSCO | SOMLS). All rights reserved. The data relating to real estate for sale on this web site comes in part from the Internet Data Exchange Program of the Oregon Datashare. Real estate listings held by IDX Brokerage firms other than Ten-X are marked with the Internet Data Exchange logo or the Internet Data Exchange thumbnail logo and detailed information about them includes the name of the listing Brokers. Information provided is for consumers' personal, non-commercial use and may not be used for any purpose other than to identify prospective properties the viewer may be interested in purchasing. The consumer will not copy, retransmit nor redistribute any of the content from this website. Information provided is deemed reliable, but not guaranteed.
© 2025 Oregon Datashare (KCAR | MLSCO | SOMLS). All rights reserved. The data relating to real estate for sale on this web site comes in part from the Internet Data Exchange Program of the Oregon Datashare. Real estate listings held by IDX Brokerage firms other than Ten-X are marked with the Internet Data Exchange logo or the Internet Data Exchange thumbnail logo and detailed information about them includes the name of the listing Brokers. Information provided is for consumers' personal, non-commercial use and may not be used for any purpose other than to identify prospective properties the viewer may be interested in purchasing. The consumer will not copy, retransmit nor redistribute any of the content from this website. Information provided is deemed reliable, but not guaranteed.