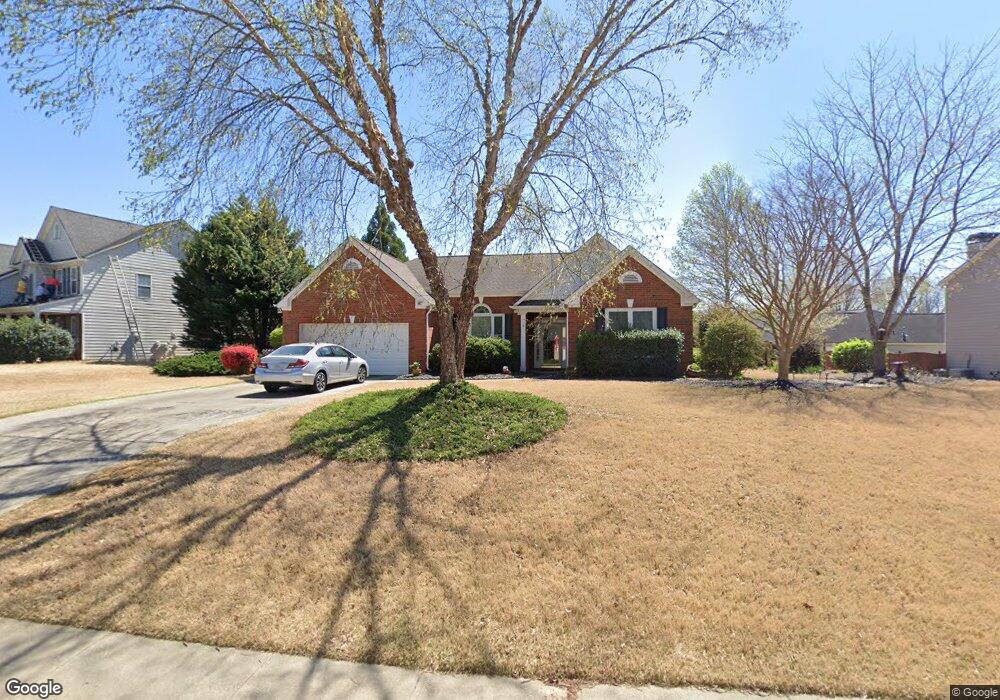
1525 Trellis Place Alpharetta, GA 30004
Estimated Value: $583,000 - $608,000
4
Beds
4
Baths
2,282
Sq Ft
$261/Sq Ft
Est. Value
About This Home
This home is located at 1525 Trellis Place, Alpharetta, GA 30004 and is currently estimated at $594,462, approximately $260 per square foot. 1525 Trellis Place is a home located in Forsyth County with nearby schools including Brandywine Elementary School, DeSana Middle School, and Denmark High School.
Ownership History
Date
Name
Owned For
Owner Type
Purchase Details
Closed on
Apr 28, 2008
Sold by
Zulauf Jeffrey K
Bought by
Walsh Kathleen L
Current Estimated Value
Home Financials for this Owner
Home Financials are based on the most recent Mortgage that was taken out on this home.
Original Mortgage
$217,350
Outstanding Balance
$137,358
Interest Rate
5.84%
Mortgage Type
New Conventional
Estimated Equity
$457,104
Purchase Details
Closed on
Mar 30, 2005
Sold by
Benton Thomas J
Bought by
Zulauf Jeffrey K
Home Financials for this Owner
Home Financials are based on the most recent Mortgage that was taken out on this home.
Original Mortgage
$180,000
Interest Rate
4.63%
Mortgage Type
New Conventional
Purchase Details
Closed on
Jun 27, 2000
Sold by
D R Horton Inc & Torrey
Bought by
Benton Thomas J
Home Financials for this Owner
Home Financials are based on the most recent Mortgage that was taken out on this home.
Original Mortgage
$160,600
Interest Rate
8%
Mortgage Type
New Conventional
Create a Home Valuation Report for This Property
The Home Valuation Report is an in-depth analysis detailing your home's value as well as a comparison with similar homes in the area
Home Values in the Area
Average Home Value in this Area
Purchase History
| Date | Buyer | Sale Price | Title Company |
|---|---|---|---|
| Walsh Kathleen L | $241,500 | -- | |
| Zulauf Jeffrey K | $226,000 | -- | |
| Benton Thomas J | $189,000 | -- |
Source: Public Records
Mortgage History
| Date | Status | Borrower | Loan Amount |
|---|---|---|---|
| Open | Walsh Kathleen L | $217,350 | |
| Previous Owner | Zulauf Jeffrey K | $180,000 | |
| Previous Owner | Benton Thomas J | $160,600 |
Source: Public Records
Tax History Compared to Growth
Tax History
| Year | Tax Paid | Tax Assessment Tax Assessment Total Assessment is a certain percentage of the fair market value that is determined by local assessors to be the total taxable value of land and additions on the property. | Land | Improvement |
|---|---|---|---|---|
| 2025 | $715 | $216,220 | $68,000 | $148,220 |
| 2024 | $715 | $212,256 | $68,000 | $144,256 |
| 2023 | $623 | $201,320 | $60,000 | $141,320 |
| 2022 | $706 | $130,160 | $40,000 | $90,160 |
| 2021 | $682 | $130,160 | $40,000 | $90,160 |
| 2020 | $3,112 | $125,220 | $40,000 | $85,220 |
| 2019 | $3,103 | $124,564 | $40,000 | $84,564 |
| 2018 | $2,650 | $102,264 | $32,000 | $70,264 |
| 2017 | $2,625 | $100,612 | $32,000 | $68,612 |
| 2016 | $2,388 | $89,412 | $24,000 | $65,412 |
| 2015 | $2,343 | $87,412 | $22,000 | $65,412 |
| 2014 | $2,010 | $79,196 | $0 | $0 |
Source: Public Records
Map
Nearby Homes
- 1245 Overland Crossing
- 1405 Overland Crossing
- 1620 Woodall View Ct
- 1293 Dalesford Dr
- 1615 Waverly Glen Dr
- 1255 Faircrest Crossing Dr
- 1570 Winshire Cove
- 1345 Faircrest Ln
- 1425 Faircrest Ln
- 255 White Pines Dr
- 1550 Township Cir
- 419 Grayson Way
- 472 Grayson Way
- 1130 Pennington View Ln
- 368 Grayson Way
- 845 Miranda Terrace
- 520 Walden Glen Ln
- 550 Central Park Overlook
- 1560 Argonne Ln
- 1410 Holly Hill Ct
- 1550 Argonne Ln
- 1420 Holly Hill Ct Unit 7
- 1540 Argonne Ln
- 1540 Argonne Ln Unit 138
- 1520 Trellis Place
- 1530 Trellis Place
- 1505 Wedgefield Ct
- 1540 Trellis Place
- 0 Trellis Place Unit 7080336
- 0 Trellis Place Unit 7328276
- 0 Trellis Place Unit 7322969
- 0 Trellis Place Unit 7299020
- 0 Trellis Place Unit 7252186
- 0 Trellis Place Unit 7227402
- 0 Trellis Place Unit 7203975
- 0 Trellis Place Unit 8618645
- 0 Trellis Place Unit 8686390
- 0 Trellis Place