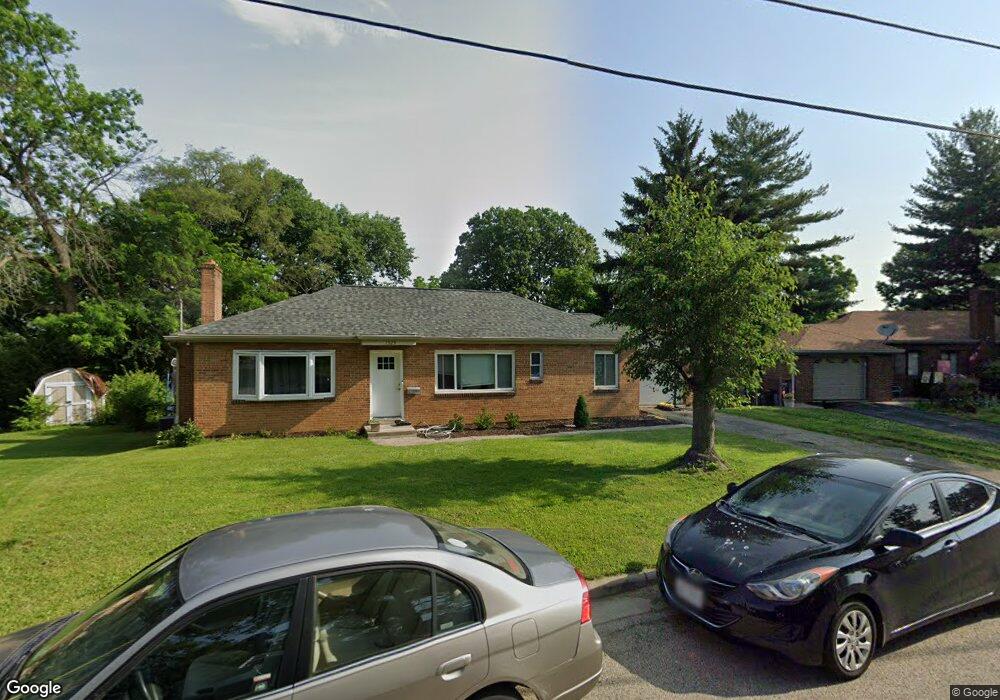
1525 Westview Ct Cincinnati, OH 45215
Estimated Value: $182,000 - $263,000
2
Beds
1
Bath
1,192
Sq Ft
$183/Sq Ft
Est. Value
About This Home
This home is located at 1525 Westview Ct, Cincinnati, OH 45215 and is currently estimated at $218,577, approximately $183 per square foot. 1525 Westview Ct is a home located in Hamilton County with nearby schools including Reading Community High School, Saints Peter and Paul Academy, and Mount Notre Dame High School.
Ownership History
Date
Name
Owned For
Owner Type
Purchase Details
Closed on
Jul 5, 2006
Sold by
Emc Mortgage Corp
Bought by
Thomas Eric
Current Estimated Value
Home Financials for this Owner
Home Financials are based on the most recent Mortgage that was taken out on this home.
Original Mortgage
$78,500
Outstanding Balance
$46,809
Interest Rate
6.73%
Mortgage Type
Unknown
Estimated Equity
$171,768
Purchase Details
Closed on
Jan 4, 2006
Sold by
Dewar Karen S and Dewar Walter W
Bought by
Emc Mortgage Corp
Purchase Details
Closed on
May 29, 1998
Sold by
Altshool John L and Bochmann Altshool Lynn
Bought by
Dwar Karen S and Dwar Walter W
Create a Home Valuation Report for This Property
The Home Valuation Report is an in-depth analysis detailing your home's value as well as a comparison with similar homes in the area
Home Values in the Area
Average Home Value in this Area
Purchase History
| Date | Buyer | Sale Price | Title Company |
|---|---|---|---|
| Thomas Eric | $78,500 | None Available | |
| Emc Mortgage Corp | $85,000 | None Available | |
| Dwar Karen S | $80,000 | -- |
Source: Public Records
Mortgage History
| Date | Status | Borrower | Loan Amount |
|---|---|---|---|
| Open | Thomas Eric | $78,500 |
Source: Public Records
Tax History Compared to Growth
Tax History
| Year | Tax Paid | Tax Assessment Tax Assessment Total Assessment is a certain percentage of the fair market value that is determined by local assessors to be the total taxable value of land and additions on the property. | Land | Improvement |
|---|---|---|---|---|
| 2024 | $3,093 | $56,956 | $17,479 | $39,477 |
| 2023 | $3,087 | $56,956 | $17,479 | $39,477 |
| 2022 | $2,496 | $35,771 | $15,180 | $20,591 |
| 2021 | $2,136 | $35,771 | $15,180 | $20,591 |
| 2020 | $2,106 | $35,771 | $15,180 | $20,591 |
| 2019 | $2,051 | $31,654 | $13,433 | $18,221 |
| 2018 | $2,052 | $31,654 | $13,433 | $18,221 |
| 2017 | $1,961 | $31,654 | $13,433 | $18,221 |
| 2016 | $1,520 | $24,354 | $13,164 | $11,190 |
| 2015 | $1,513 | $24,354 | $13,164 | $11,190 |
| 2014 | $1,329 | $24,354 | $13,164 | $11,190 |
| 2013 | $1,348 | $24,850 | $13,433 | $11,417 |
Source: Public Records
Map
Nearby Homes
- 1521 Hunt Rd
- 69 Orchard Knoll Dr
- 21 Orchard Knoll Dr
- 234 Mcguire Ln
- 109 Calico Ct
- 9 W North St
- 18 Gahl Terrace
- 16 Gahl Terrace
- 310 E Vine St
- 1955 Hunt Rd
- 1009 5th St
- 2132 Trailridge Dr
- 134 Walnut St
- 8914 Reading Rd
- 1013 Market St
- 1421 Jefferson Ave
- 116 Pike St
- 1626 Krylon Dr
- 797 4th St
- 1246 Thurnridge Dr
- 1519 Westview Ct
- 1529 Westview Ct
- 1612 Hunt Rd
- 1608 Hunt Rd
- 1702 Hunt Rd
- 1700 Hunt Rd
- 1704 Hunt Rd
- 1515 Westview Ct
- 1604 Hunt Rd
- 3515 Westview Ct
- 1708 Hunt Rd
- 1535 Westview Ct
- 1600 Hunt Rd
- 1712 Hunt Rd
- 1544 Hunt Rd
- 1524 Westview Ct
- 1536 Hunt Rd
- 1718 Hunt Rd
- 1541 Westview Ct
- 1541 Westview Ct Unit 45215