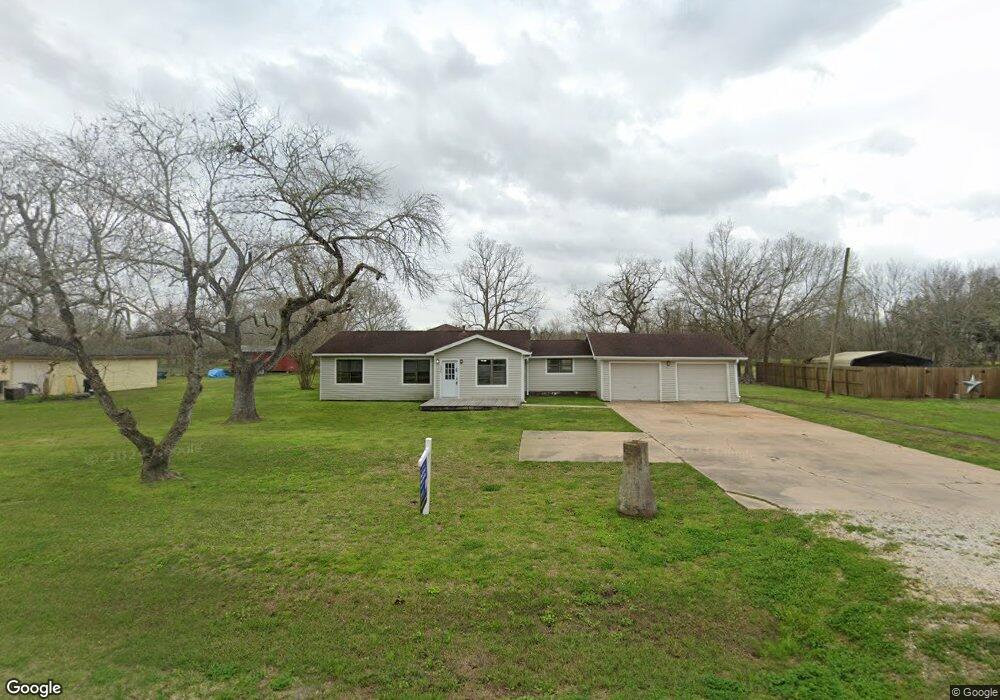
1526 County Road 597 Unit FIG Angleton, TX 77515
Estimated Value: $215,000 - $286,000
Studio
1
Bath
2,206
Sq Ft
$118/Sq Ft
Est. Value
About This Home
This home is located at 1526 County Road 597 Unit FIG, Angleton, TX 77515 and is currently estimated at $261,319, approximately $118 per square foot. 1526 County Road 597 Unit FIG is a home located in Brazoria County with nearby schools including Southside Elementary School, Angleton Junior High School, and Angleton High School.
Ownership History
Date
Name
Owned For
Owner Type
Purchase Details
Closed on
Apr 12, 2024
Sold by
Opendoor Property J Llc
Bought by
Dean Amber
Current Estimated Value
Home Financials for this Owner
Home Financials are based on the most recent Mortgage that was taken out on this home.
Original Mortgage
$220,924
Outstanding Balance
$216,021
Interest Rate
6.94%
Mortgage Type
New Conventional
Estimated Equity
$45,298
Purchase Details
Closed on
Jun 4, 2019
Sold by
Herder Jeffery A and Herder Billie L
Bought by
Gobar Llc
Purchase Details
Closed on
May 10, 2005
Sold by
Bank Of America Na
Bought by
Herder Jeffery A and Herder Billie L
Purchase Details
Closed on
Dec 11, 2003
Sold by
Ramirez Joe and Ramirez Lella
Bought by
Bank Of America Na
Home Financials for this Owner
Home Financials are based on the most recent Mortgage that was taken out on this home.
Original Mortgage
$33,206
Interest Rate
5.94%
Mortgage Type
Purchase Money Mortgage
Create a Home Valuation Report for This Property
The Home Valuation Report is an in-depth analysis detailing your home's value as well as a comparison with similar homes in the area
Home Values in the Area
Average Home Value in this Area
Purchase History
| Date | Buyer | Sale Price | Title Company |
|---|---|---|---|
| Dean Amber | -- | None Listed On Document | |
| Gobar Llc | -- | Fidelity National Title | |
| Herder Jeffery A | -- | First American Title | |
| Bank Of America Na | $40,549 | -- |
Source: Public Records
Mortgage History
| Date | Status | Borrower | Loan Amount |
|---|---|---|---|
| Open | Dean Amber | $220,924 | |
| Previous Owner | Bank Of America Na | $33,206 |
Source: Public Records
Tax History
| Year | Tax Paid | Tax Assessment Tax Assessment Total Assessment is a certain percentage of the fair market value that is determined by local assessors to be the total taxable value of land and additions on the property. | Land | Improvement |
|---|---|---|---|---|
| 2025 | $2,921 | $243,340 | $22,500 | $220,840 |
| 2023 | $2,921 | $236,290 | $12,750 | $223,540 |
| 2022 | $3,738 | $193,260 | $11,900 | $181,360 |
| 2021 | $4,193 | $192,410 | $11,050 | $181,360 |
| 2020 | $4,169 | $180,230 | $11,050 | $169,180 |
| 2019 | $2,123 | $88,000 | $11,050 | $76,950 |
| 2018 | $2,414 | $98,270 | $11,050 | $87,220 |
| 2017 | $2,336 | $98,270 | $11,050 | $87,220 |
| 2016 | $2,124 | $86,830 | $10,200 | $76,630 |
| 2015 | $1,462 | $78,230 | $8,500 | $69,730 |
| 2014 | $1,462 | $69,910 | $8,500 | $61,410 |
Source: Public Records
Map
Nearby Homes
- 1925 County Road 543
- 14515 Farm To Market Road 523
- 426 County Road 243
- 1200 Gifford Ln
- 1348 Gifford Rd
- 209 Laura Leigh Ln
- 205 Laura Leigh Ln
- 104 Lisa Marie Dr
- 0 Hoelewyn Dr Unit 23337646
- 000 Hoelewyn Dr
- 838 Oak Ridge Dr
- 1233 Caldwell Rd
- 2217 Shanks Rd
- 2025 Shanks Rd
- 2125 Shanks Rd
- 0 Shanks Rd
- 00 Shanks Rd
- 2213 Shanks Rd
- 174 Indian St
- 2313 Shanks Rd
- 1526 County Road 597
- 1526 Fig Ln
- 1531 Fig Ln
- 1522 County Road 597 Unit FIG
- 1522 County Road 597
- 1522 Fig Ln Unit 597
- 1531 County Road 597 Unit FIG
- 1527 County Road 597 Unit FIG
- 1527 County Road 597
- 1527 County Road 597
- 1527 County Road 597
- 1523 County Road 597 Unit FIG
- 1523 County Road 597
- 1530 County Road 597 Unit FIG
- 1537 County Road 597 Unit FIG
- 1513 Fig Ln
- 1519 County Road 597
- 1540 County Road 597 Unit FIG
- 1542 County Road 597
- 1510 County Road 597 Unit FIG
Your Personal Tour Guide
Ask me questions while you tour the home.