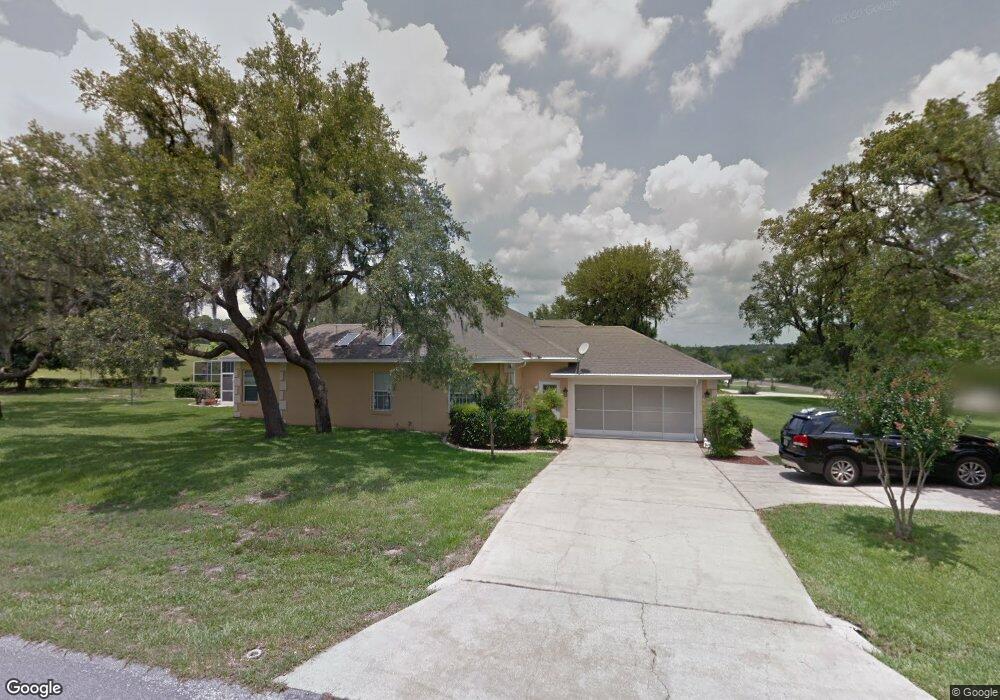
1526 E Monopoly Loop Inverness, FL 34453
Estimated Value: $436,000 - $514,000
3
Beds
4
Baths
2,968
Sq Ft
$161/Sq Ft
Est. Value
About This Home
This home is located at 1526 E Monopoly Loop, Inverness, FL 34453 and is currently estimated at $476,568, approximately $160 per square foot. 1526 E Monopoly Loop is a home located in Citrus County with nearby schools including Hernando Elementary School, Inverness Middle School, and Citrus High School.
Ownership History
Date
Name
Owned For
Owner Type
Purchase Details
Closed on
May 7, 2024
Sold by
Thomas Allan and Seich Michael G
Bought by
Thomas Seich Revocable Trust and Thomas
Current Estimated Value
Purchase Details
Closed on
Nov 2, 2023
Sold by
Hoey Family Trust
Bought by
Thomas Allan and Seich Michael G
Purchase Details
Closed on
Jul 8, 2015
Sold by
Hoey Kathleen T
Bought by
Hoey Kathleen T and The Hoey Family Trust
Purchase Details
Closed on
Nov 29, 2001
Sold by
Hoey Thomas J and Hoey Kathleen T
Bought by
Hoey Thomas J and Hoey Kathleen T
Purchase Details
Closed on
Nov 1, 2001
Bought by
Hoey Kathleen T and The Hoey Family Trust Dtd 7/7/15
Purchase Details
Closed on
Mar 1, 1999
Bought by
Hoey Kathleen T and The Hoey Family Trust Dtd 7/7/15
Purchase Details
Closed on
Mar 1, 1998
Bought by
Hoey Kathleen T and The Hoey Family Trust Dtd 7/7/15
Purchase Details
Closed on
Apr 1, 1992
Bought by
Hoey Kathleen T and The Hoey Family Trust Dtd 7/7/15
Create a Home Valuation Report for This Property
The Home Valuation Report is an in-depth analysis detailing your home's value as well as a comparison with similar homes in the area
Home Values in the Area
Average Home Value in this Area
Purchase History
| Date | Buyer | Sale Price | Title Company |
|---|---|---|---|
| Thomas Seich Revocable Trust | $100 | None Listed On Document | |
| Thomas Allan | $430,000 | Title Usa | |
| Thomas Allan | $430,000 | Title Usa | |
| Hoey Kathleen T | -- | Attorney | |
| Hoey Kathleen T | -- | Attorney | |
| Hoey Thomas J | -- | -- | |
| Hoey Kathleen T | $100 | -- | |
| Hoey Kathleen T | $100 | -- | |
| Hoey Kathleen T | $165,000 | -- | |
| Hoey Kathleen T | $21,900 | -- |
Source: Public Records
Tax History
| Year | Tax Paid | Tax Assessment Tax Assessment Total Assessment is a certain percentage of the fair market value that is determined by local assessors to be the total taxable value of land and additions on the property. | Land | Improvement |
|---|---|---|---|---|
| 2025 | $2,435 | $201,958 | -- | -- |
| 2024 | $6,156 | $196,266 | -- | -- |
| 2023 | $6,156 | $397,329 | $17,200 | $380,129 |
| 2022 | $2,365 | $190,616 | $0 | $0 |
| 2021 | $2,271 | $185,064 | $0 | $0 |
| 2020 | $2,171 | $241,023 | $11,750 | $229,273 |
| 2019 | $2,143 | $218,877 | $11,750 | $207,127 |
| 2018 | $2,116 | $199,421 | $11,750 | $187,671 |
| 2017 | $2,109 | $171,478 | $8,910 | $162,568 |
| 2016 | $2,135 | $167,951 | $10,840 | $157,111 |
| 2015 | $2,167 | $166,784 | $13,360 | $153,424 |
| 2014 | $2,223 | $165,460 | $14,114 | $151,346 |
Source: Public Records
Map
Nearby Homes
- 1085 N Spend A Buck Dr
- 1191 N Chance Way
- 1329 N Mediterranean Way
- 917 N Bennington Terrace
- 1725 E Monopoly Loop
- 1141 N Cherry Pop Dr
- 1429 E Allegrie Dr
- 1439 E Allegrie Dr
- 636 N Cherry Pop Dr
- 841 N Lafayette Way
- 784 N Lafayette Way
- 1885 E Monopoly Loop
- 1455 E Hartford St
- 1464 N Hambletonian Dr
- 1843 E Saint James Loop
- 1876 E Monopoly Loop
- 1159 N Nashua Terrace
- 898 E Liberty St
- 1995 E Newhaven St
- 100 N Hambletonian Dr
- 1611 E Liberty
- 1518 E Monopoly Loop
- 1534 E Monopoly Loop
- 1508 E Monopoly Loop
- 1037 N Spend A Buck Dr
- 1527 E Monopoly Loop
- 1542 E Monopoly Loop
- 1500 E Monopoly Loop
- 1517 E Monopoly Loop
- 1549 E Monopoly Loop
- 993 Spend A Buck Dr
- 1550 E Monopoly Loop
- 959 N Spend A Buck Dr
- 1113 N Spend A Buck Dr
- 1484 E Monopoly Loop
- 1076 N Spend A Buck
- 976 N Chance Way
- 958 N Chance Way
- 1111 N Mediterranean Way
- 1085 1085 Spend A Buck
Your Personal Tour Guide
Ask me questions while you tour the home.