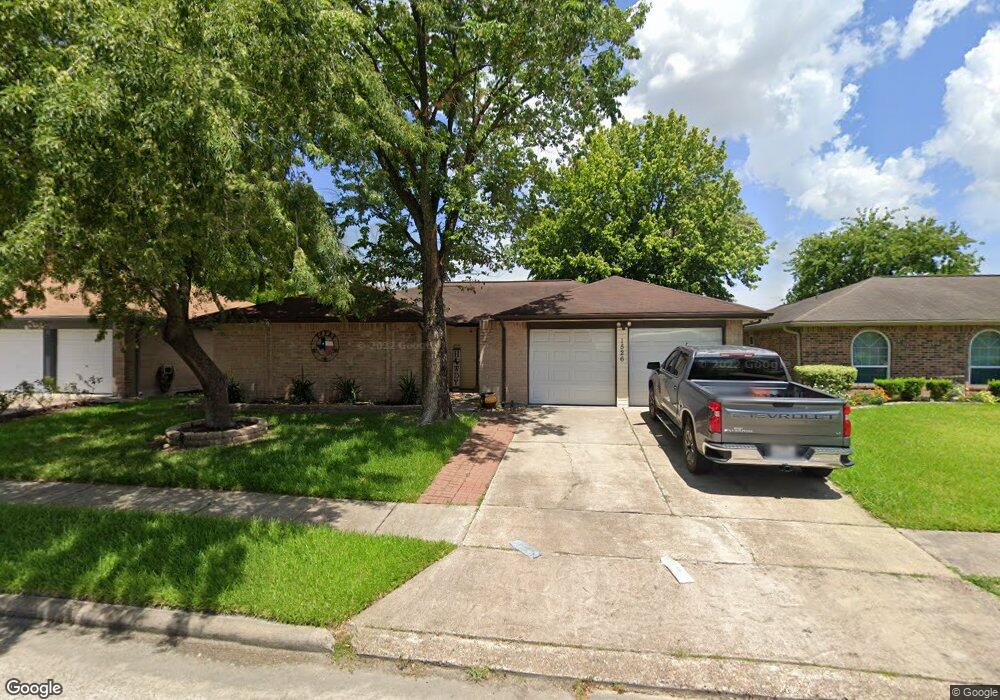
1526 Littleport Ln Channelview, TX 77530
Estimated Value: $201,000 - $221,128
3
Beds
2
Baths
1,491
Sq Ft
$141/Sq Ft
Est. Value
About This Home
This home is located at 1526 Littleport Ln, Channelview, TX 77530 and is currently estimated at $210,282, approximately $141 per square foot. 1526 Littleport Ln is a home located in Harris County with nearby schools including Channelview High School and Family Christian Academy.
Ownership History
Date
Name
Owned For
Owner Type
Purchase Details
Closed on
Mar 17, 2017
Sold by
Riodan Leslie L
Bought by
Smith Joshua Lee
Current Estimated Value
Home Financials for this Owner
Home Financials are based on the most recent Mortgage that was taken out on this home.
Original Mortgage
$130,063
Outstanding Balance
$108,449
Interest Rate
4.37%
Mortgage Type
FHA
Estimated Equity
$101,833
Purchase Details
Closed on
Oct 19, 2005
Sold by
Riordan Annalisa Renee and Pate Annalisa Renee
Bought by
Riordan Leslie L and Riordan Annalisa Renee
Home Financials for this Owner
Home Financials are based on the most recent Mortgage that was taken out on this home.
Original Mortgage
$85,600
Interest Rate
5.73%
Mortgage Type
Stand Alone First
Purchase Details
Closed on
Nov 30, 2000
Sold by
Pate Robert Martin
Bought by
Pate Annalisa Renee
Purchase Details
Closed on
Aug 22, 1994
Sold by
Latour Joseph Rocky
Bought by
Pate Robert M
Create a Home Valuation Report for This Property
The Home Valuation Report is an in-depth analysis detailing your home's value as well as a comparison with similar homes in the area
Home Values in the Area
Average Home Value in this Area
Purchase History
| Date | Buyer | Sale Price | Title Company |
|---|---|---|---|
| Smith Joshua Lee | -- | None Available | |
| Riordan Leslie L | -- | -- | |
| Pate Annalisa Renee | -- | -- | |
| Pate Robert M | -- | -- |
Source: Public Records
Mortgage History
| Date | Status | Borrower | Loan Amount |
|---|---|---|---|
| Open | Smith Joshua Lee | $130,063 | |
| Previous Owner | Riordan Leslie L | $85,600 | |
| Closed | Pate Annalisa Renee | $0 |
Source: Public Records
Tax History Compared to Growth
Tax History
| Year | Tax Paid | Tax Assessment Tax Assessment Total Assessment is a certain percentage of the fair market value that is determined by local assessors to be the total taxable value of land and additions on the property. | Land | Improvement |
|---|---|---|---|---|
| 2025 | $2,665 | $188,095 | $37,015 | $151,080 |
| 2024 | $2,665 | $190,950 | $37,015 | $153,935 |
| 2023 | $2,665 | $196,463 | $37,015 | $159,448 |
| 2022 | $3,801 | $172,543 | $37,015 | $135,528 |
| 2021 | $3,659 | $150,542 | $37,015 | $113,527 |
| 2020 | $3,636 | $132,111 | $37,015 | $95,096 |
| 2019 | $3,653 | $127,694 | $31,075 | $96,619 |
| 2018 | $1,272 | $116,097 | $30,049 | $86,048 |
| 2017 | $2,858 | $116,097 | $30,049 | $86,048 |
| 2016 | $2,598 | $97,116 | $24,039 | $73,077 |
| 2015 | $1,978 | $86,469 | $13,823 | $72,646 |
| 2014 | $1,978 | $80,250 | $11,419 | $68,831 |
Source: Public Records
Map
Nearby Homes
- 1502 Stevenage Ln
- 15215 Peachmeadow Ln
- 15223 Bedford Glen Dr
- 1343 Littleport Ln
- 15822 Mesenbrink Ln
- 1330 Stevenage Ln
- 15262 Mincing Ln
- 1714 Laura Anne Dr
- 16111 Marcelia Dr
- 1323 Padstow Ln
- 14854 Shottery Dr
- 1423 Seafield Dr
- 16007 Makayla Dr
- 14951 Scotter Dr
- 16206 Darrian Ln
- 15911 Breanna Ln
- 14918 Silver Green Dr S
- 909 Pennygent Ln
- 14847 Shottery Dr
- 1315 Goswell Ln
- 1522 Littleport Ln
- 1530 Littleport Ln
- 1527 Macclesby Ln
- 1523 Macclesby Ln
- 1518 Littleport Ln
- 1531 Macclesby Ln
- 1534 Littleport Ln
- 1519 Macclesby Ln
- 1527 Littleport Ln
- 1523 Littleport Ln
- 1531 Littleport Ln
- 1535 Macclesby Ln
- 1514 Littleport Ln
- 1519 Littleport Ln
- 1515 Macclesby Ln
- 15055 Peachmeadow Ln
- 1539 Macclesby Ln
- 1515 Littleport Ln
- 1510 Littleport Ln
- 15046 Peachmeadow Ln