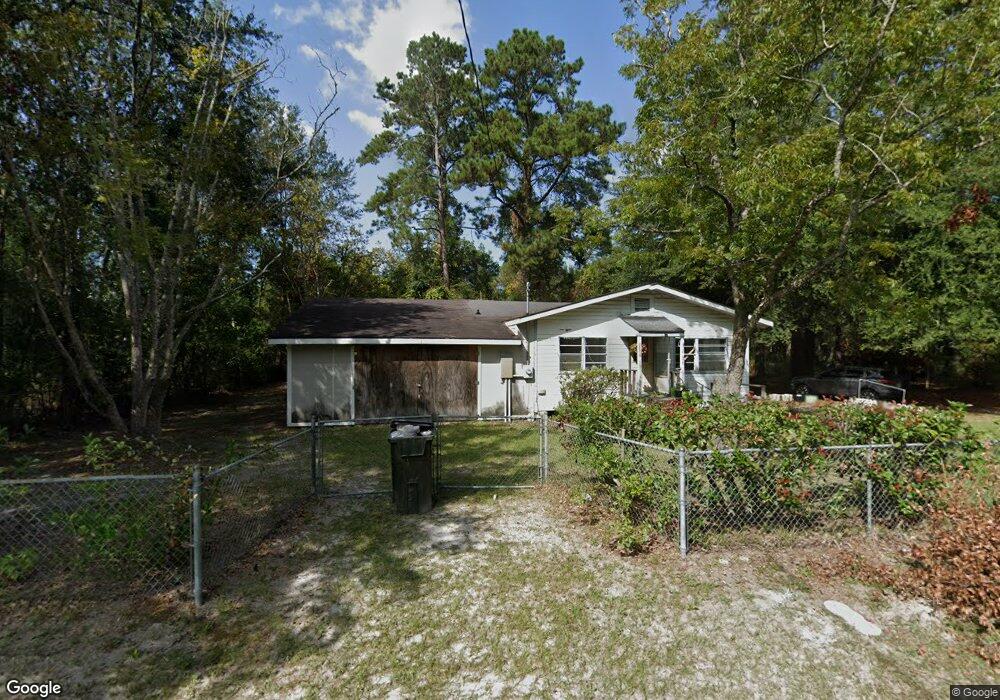
1526 Myers Ave Waycross, GA 31503
Estimated Value: $75,000 - $116,714
3
Beds
2
Baths
1,383
Sq Ft
$66/Sq Ft
Est. Value
About This Home
This home is located at 1526 Myers Ave, Waycross, GA 31503 and is currently estimated at $91,429, approximately $66 per square foot. 1526 Myers Ave is a home located in Ware County with nearby schools including Waresboro Elementary School, Ware County Middle School, and Ware County High School.
Ownership History
Date
Name
Owned For
Owner Type
Purchase Details
Closed on
Sep 11, 2023
Sold by
Housing & Urban Development
Bought by
Johnson Marion D
Current Estimated Value
Purchase Details
Closed on
Mar 7, 2023
Sold by
Midfirst Bank
Bought by
First Party and Secretary Of Housing & Urban Development
Purchase Details
Closed on
Nov 28, 2007
Sold by
Lunsford Becky M
Bought by
Brown Boysie E and Brown Mary E
Home Financials for this Owner
Home Financials are based on the most recent Mortgage that was taken out on this home.
Original Mortgage
$60,057
Interest Rate
6.22%
Mortgage Type
FHA
Purchase Details
Closed on
May 19, 2005
Sold by
Glenn Thelma Lynette Kirkl
Bought by
Lunsford Becky M
Home Financials for this Owner
Home Financials are based on the most recent Mortgage that was taken out on this home.
Original Mortgage
$43,500
Interest Rate
5.74%
Mortgage Type
New Conventional
Purchase Details
Closed on
Oct 2, 2000
Sold by
Best Charles L and Best Nancy A
Bought by
Glen Thelma L
Create a Home Valuation Report for This Property
The Home Valuation Report is an in-depth analysis detailing your home's value as well as a comparison with similar homes in the area
Home Values in the Area
Average Home Value in this Area
Purchase History
| Date | Buyer | Sale Price | Title Company |
|---|---|---|---|
| Johnson Marion D | $49,100 | -- | |
| First Party | -- | -- | |
| Midfirst Bank | $46,640 | -- | |
| Brown Boysie E | $61,000 | -- | |
| Lunsford Becky M | $43,500 | -- | |
| Glen Thelma L | -- | -- |
Source: Public Records
Mortgage History
| Date | Status | Borrower | Loan Amount |
|---|---|---|---|
| Previous Owner | Brown Boysie E | $60,057 | |
| Previous Owner | Lunsford Becky M | $43,500 |
Source: Public Records
Tax History Compared to Growth
Tax History
| Year | Tax Paid | Tax Assessment Tax Assessment Total Assessment is a certain percentage of the fair market value that is determined by local assessors to be the total taxable value of land and additions on the property. | Land | Improvement |
|---|---|---|---|---|
| 2024 | $191 | $26,277 | $2,960 | $23,317 |
| 2023 | $170 | $26,684 | $2,091 | $24,593 |
| 2022 | $40 | $26,684 | $2,091 | $24,593 |
| 2021 | $922 | $21,338 | $2,091 | $19,247 |
| 2020 | $918 | $21,070 | $2,091 | $18,979 |
| 2019 | $754 | $17,056 | $2,091 | $14,965 |
| 2018 | $0 | $16,387 | $2,091 | $14,296 |
| 2017 | -- | $16,387 | $2,091 | $14,296 |
| 2016 | -- | $16,387 | $2,091 | $14,296 |
| 2015 | $1 | $16,387 | $2,091 | $14,296 |
| 2014 | $1 | $16,387 | $2,091 | $14,296 |
| 2013 | -- | $17,503 | $2,090 | $15,412 |
Source: Public Records
Map
Nearby Homes
- 6905 Kendal Ct
- 0 Camp Branch Cross Rd Unit 12958956
- 0 Camp Branch Cross Rd Unit 147575
- 0 Camp Branch Cross Rd Unit 10127958
- 1401 Carswell Ave
- 00 Roosevelt St
- 1322 Jane St
- 0 S Georgia Pkwy W
- 605 Walker St
- 1208 Margaret St
- 1006 Roosevelt St
- 1003 Carswell Ave
- 601 N Nicholls St
- 505 N Nicholls St
- 503 N Nicholls St
- 1125 Georgia St
- 1103 Ann St
- 506 McDonald St
- 1027 Robert St
- 516 Folks St
- 1527 Roosevelt St
- 1522 Myers Ave
- 1533 Roosevelt St
- 1524 Carswell Ave
- 1516 Myers Ave
- 706 Columbus St
- 606 Columbus St
- 1515 Roosevelt St
- 1528 Roosevelt St
- 1522 Carswell Ave
- 1512 Carswell Ave
- 1530 Roosevelt St
- 1518 Carswell Ave
- 800 Columbus St
- 1528 Carswell Ave
- 1520 Roosevelt St
- 1527 Ketterer St
- 1510 Myers Ave
- 1527 N Ketterer
- 1525 Ketterer St