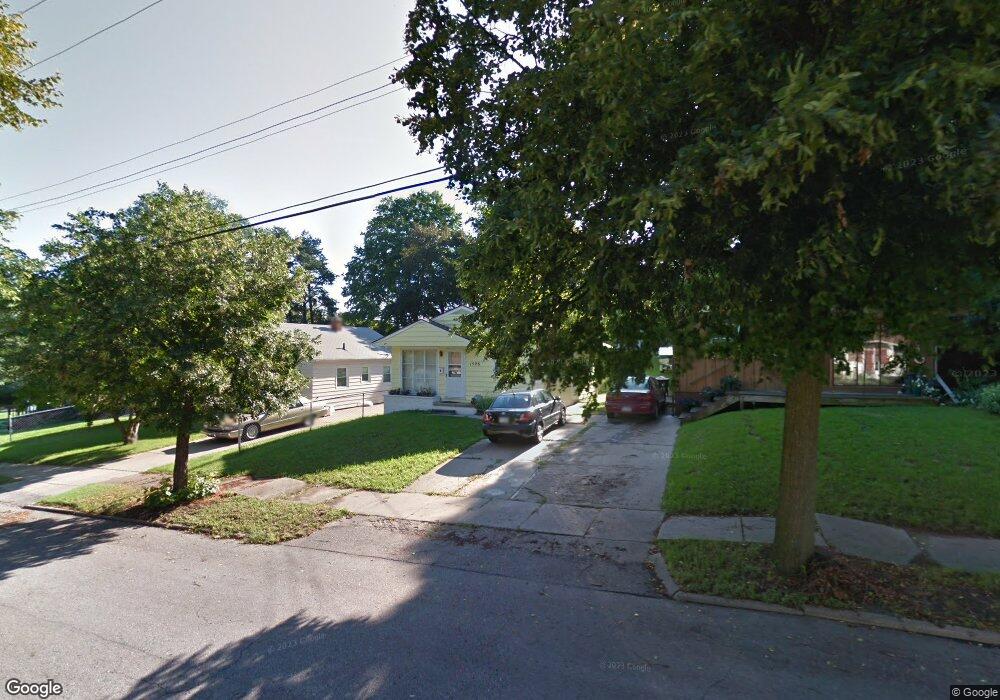
1526 Roseneath Ave Lansing, MI 48915
Knollwood Willow NeighborhoodEstimated Value: $85,916 - $113,000
2
Beds
1
Bath
720
Sq Ft
$132/Sq Ft
Est. Value
About This Home
This home is located at 1526 Roseneath Ave, Lansing, MI 48915 and is currently estimated at $95,229, approximately $132 per square foot. 1526 Roseneath Ave is a home located in Ingham County with nearby schools including Willow School, Pattengill Academy, and J.W. Sexton High School.
Ownership History
Date
Name
Owned For
Owner Type
Purchase Details
Closed on
Jul 1, 2009
Sold by
Down Evan and Down Mary Beth
Bought by
Henigan Loretta F
Current Estimated Value
Home Financials for this Owner
Home Financials are based on the most recent Mortgage that was taken out on this home.
Original Mortgage
$38,784
Outstanding Balance
$24,728
Interest Rate
4.94%
Mortgage Type
FHA
Estimated Equity
$70,501
Purchase Details
Closed on
Oct 31, 2007
Sold by
Wm Specialty Mortgage Llc
Bought by
Reo Nationwide Llc
Purchase Details
Closed on
Sep 28, 2006
Sold by
Weadle Douglas W and Curry Rosemary E
Bought by
Wm Specialty Mortgage Llc
Purchase Details
Closed on
Aug 31, 1998
Sold by
Miller Hilary A and Miller Geraldine
Bought by
Weadle Douglas and Weadle Rosemarie
Purchase Details
Closed on
Feb 1, 1992
Create a Home Valuation Report for This Property
The Home Valuation Report is an in-depth analysis detailing your home's value as well as a comparison with similar homes in the area
Home Values in the Area
Average Home Value in this Area
Purchase History
| Date | Buyer | Sale Price | Title Company |
|---|---|---|---|
| Henigan Loretta F | $39,500 | Parks Title | |
| Reo Nationwide Llc | $3,000 | None Available | |
| Wm Specialty Mortgage Llc | $77,886 | None Available | |
| Weadle Douglas | $38,900 | -- | |
| -- | $14,000 | -- |
Source: Public Records
Mortgage History
| Date | Status | Borrower | Loan Amount |
|---|---|---|---|
| Open | Henigan Loretta F | $38,784 |
Source: Public Records
Tax History Compared to Growth
Tax History
| Year | Tax Paid | Tax Assessment Tax Assessment Total Assessment is a certain percentage of the fair market value that is determined by local assessors to be the total taxable value of land and additions on the property. | Land | Improvement |
|---|---|---|---|---|
| 2025 | $1,345 | $30,200 | $2,800 | $27,400 |
| 2024 | $10 | $29,400 | $2,800 | $26,600 |
| 2023 | $1,264 | $25,000 | $2,800 | $22,200 |
| 2022 | $1,145 | $21,500 | $2,900 | $18,600 |
| 2021 | $1,121 | $20,400 | $3,400 | $17,000 |
| 2020 | $1,114 | $19,500 | $3,400 | $16,100 |
| 2019 | $1,064 | $18,800 | $3,400 | $15,400 |
| 2018 | $1,001 | $16,200 | $3,400 | $12,800 |
| 2017 | $957 | $16,200 | $3,400 | $12,800 |
| 2016 | $977 | $16,000 | $3,400 | $12,600 |
| 2015 | $977 | $15,500 | $6,793 | $8,707 |
| 2014 | $977 | $16,400 | $10,000 | $6,400 |
Source: Public Records
Map
Nearby Homes
- 1430 N Martin Luther King jr Blvd
- 1616 Roseneath Ave
- 1537 Roselawn Ave
- 1422 Redwood St
- 1320 Glenrose Ave
- 1432 Redwood St
- 1224 Theodore St
- 1129 N Martin Luther King jr Blvd
- 1327 N Jenison Ave
- 1620 Comfort St
- 1300 W Maple St
- 1310 W Maple St
- 406 Pleasant St
- 1019 Daleford St
- 624 Brook St
- 423 W César E Chávez Ave
- 908 Clyde St
- 407 W César E Chávez Ave
- 921 N Sycamore St
- 820 Princeton Ave
- 1530 Roseneath Ave
- 1538 Roseneath Ave
- 1520 Roseneath Ave
- 1529 Lansing Ave
- 1521 Lansing Ave
- 1535 Lansing Ave
- 1514 Roseneath Ave
- 1011 Greenwood Ave
- 1527 Roseneath Ave
- 1531 Roseneath Ave
- 1510 Roseneath Ave
- 1005 Greenwood Ave
- 1535 Roseneath Ave
- 1539 Roseneath Ave
- 1511 Lansing Ave
- 1515 Roseneath Ave
- 1539 Lansing Ave
- 1033 Greenwood Ave
- 1515 E Mount