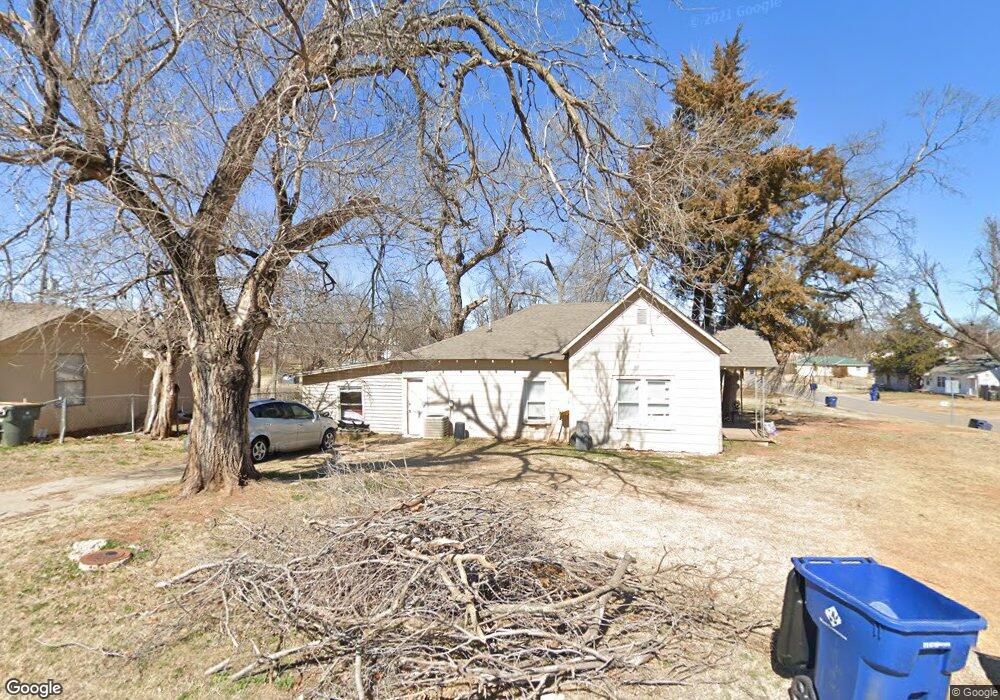
1526 S 8th St Chickasha, OK 73018
Estimated Value: $88,000 - $141,000
3
Beds
1
Bath
1,365
Sq Ft
$89/Sq Ft
Est. Value
About This Home
This home is located at 1526 S 8th St, Chickasha, OK 73018 and is currently estimated at $122,103, approximately $89 per square foot. 1526 S 8th St is a home located in Grady County with nearby schools including Grand Avenue Elementary School, Chickasha Middle School, and Lincoln Elementary School.
Ownership History
Date
Name
Owned For
Owner Type
Purchase Details
Closed on
Oct 5, 2011
Sold by
Mcnan Properties Llc
Bought by
Mccarther Investment Properties Llc
Current Estimated Value
Home Financials for this Owner
Home Financials are based on the most recent Mortgage that was taken out on this home.
Original Mortgage
$34,000
Outstanding Balance
$3,228
Interest Rate
4.17%
Mortgage Type
Unknown
Estimated Equity
$118,875
Purchase Details
Closed on
Apr 3, 2008
Sold by
Stallbaumer Mark W and Stallbaumer Sue A
Bought by
Mcnatt Properties Llc
Purchase Details
Closed on
Dec 31, 1996
Sold by
Lucille Blackburn
Bought by
Mark W Stallbaumer
Purchase Details
Closed on
Apr 6, 1995
Sold by
Tammi and Ricky Bailey
Bought by
Lucille Blackburn
Purchase Details
Closed on
Jul 11, 1994
Sold by
Berkley Fd Bank
Bought by
Tami Bailey
Create a Home Valuation Report for This Property
The Home Valuation Report is an in-depth analysis detailing your home's value as well as a comparison with similar homes in the area
Home Values in the Area
Average Home Value in this Area
Purchase History
| Date | Buyer | Sale Price | Title Company |
|---|---|---|---|
| Mccarther Investment Properties Llc | $28,000 | None Available | |
| Mcnatt Properties Llc | $10,000 | None Available | |
| Mark W Stallbaumer | $14,200 | -- | |
| Lucille Blackburn | $13,000 | -- | |
| Tami Bailey | $9,000 | -- |
Source: Public Records
Mortgage History
| Date | Status | Borrower | Loan Amount |
|---|---|---|---|
| Open | Mccarther Investment Properties Llc | $34,000 |
Source: Public Records
Tax History Compared to Growth
Tax History
| Year | Tax Paid | Tax Assessment Tax Assessment Total Assessment is a certain percentage of the fair market value that is determined by local assessors to be the total taxable value of land and additions on the property. | Land | Improvement |
|---|---|---|---|---|
| 2024 | $522 | $5,149 | $922 | $4,227 |
| 2023 | $522 | $4,904 | $912 | $3,992 |
| 2022 | $494 | $4,753 | $761 | $3,992 |
| 2021 | $457 | $4,550 | $728 | $3,822 |
| 2020 | $446 | $4,333 | $705 | $3,628 |
| 2019 | $417 | $4,128 | $672 | $3,456 |
| 2018 | $405 | $3,931 | $336 | $3,595 |
| 2017 | $388 | $3,744 | $329 | $3,415 |
| 2016 | $372 | $3,566 | $313 | $3,253 |
| 2015 | $339 | $3,396 | $318 | $3,078 |
| 2014 | $339 | $3,234 | $309 | $2,925 |
Source: Public Records
Map
Nearby Homes
- 808 W Virginia Ave
- 1524 S 8th St
- 810 W Virginia Ave
- 1602 S 8th St
- 1520 S 8th St
- 1509 S 8th St
- 728 W Virginia Ave
- 1604 S 8th St
- 1507 S 8th St
- 727 W Virginia Ave
- 724 W Virginia Ave
- 1616 S 8th St
- 1501 S 8th St
- 1502 S 8th St
- 1511 S 9th St
- 1620 S 8th St
- 1615 S 8th St
- 1607 S 8th St
- 1601 S 9th St
- 1607 S 9th St