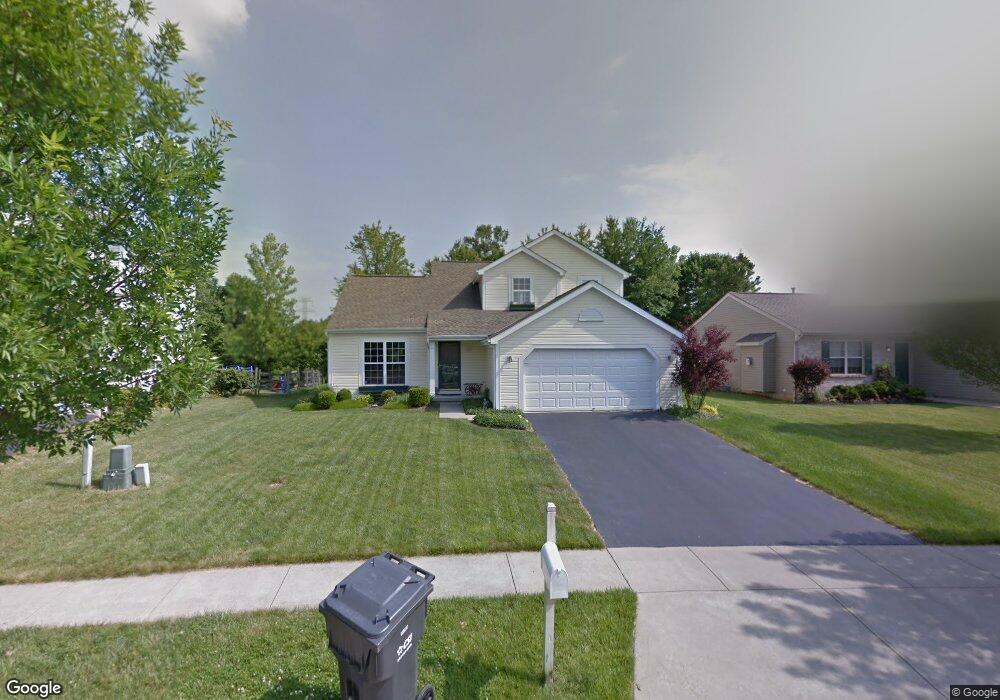
1526 Summit Ridge Rd Loveland, OH 45140
Outer Loveland NeighborhoodEstimated Value: $404,000 - $416,000
3
Beds
4
Baths
1,836
Sq Ft
$224/Sq Ft
Est. Value
About This Home
This home is located at 1526 Summit Ridge Rd, Loveland, OH 45140 and is currently estimated at $411,513, approximately $224 per square foot. 1526 Summit Ridge Rd is a home located in Clermont County with nearby schools including Milford Senior High School, Milford Christian Academy, and St. Andrew - St. Elizabeth Ann Seton School.
Ownership History
Date
Name
Owned For
Owner Type
Purchase Details
Closed on
Apr 17, 2009
Sold by
Culberson Debbie
Bought by
Fletcher Michael C
Current Estimated Value
Purchase Details
Closed on
Mar 17, 2008
Sold by
Aldana Benjamin D and Aldana Elizabeth C
Bought by
Barger Arthur and Barger Lynn M
Home Financials for this Owner
Home Financials are based on the most recent Mortgage that was taken out on this home.
Original Mortgage
$201,832
Interest Rate
6.09%
Mortgage Type
FHA
Purchase Details
Closed on
Dec 2, 1999
Sold by
M/I Schottenstein Homes
Bought by
Aldana Benjamin D and Aldana Elizabeth C
Home Financials for this Owner
Home Financials are based on the most recent Mortgage that was taken out on this home.
Original Mortgage
$162,900
Interest Rate
7.97%
Mortgage Type
New Conventional
Create a Home Valuation Report for This Property
The Home Valuation Report is an in-depth analysis detailing your home's value as well as a comparison with similar homes in the area
Home Values in the Area
Average Home Value in this Area
Purchase History
| Date | Buyer | Sale Price | Title Company |
|---|---|---|---|
| Fletcher Michael C | -- | Attorney | |
| Culberson Debbie | $175,000 | Attorney | |
| Barger Arthur | $205,000 | None Available | |
| Aldana Benjamin D | $170,530 | -- |
Source: Public Records
Mortgage History
| Date | Status | Borrower | Loan Amount |
|---|---|---|---|
| Previous Owner | Barger Arthur | $201,832 | |
| Previous Owner | Aldana Benjamin D | $162,900 |
Source: Public Records
Tax History Compared to Growth
Tax History
| Year | Tax Paid | Tax Assessment Tax Assessment Total Assessment is a certain percentage of the fair market value that is determined by local assessors to be the total taxable value of land and additions on the property. | Land | Improvement |
|---|---|---|---|---|
| 2024 | $5,112 | $111,270 | $18,170 | $93,100 |
| 2023 | $5,164 | $111,270 | $18,170 | $93,100 |
| 2022 | $4,703 | $77,180 | $12,600 | $64,580 |
| 2021 | $4,708 | $77,180 | $12,600 | $64,580 |
| 2020 | $4,514 | $77,180 | $12,600 | $64,580 |
| 2019 | $4,521 | $73,470 | $12,600 | $60,870 |
| 2018 | $4,522 | $73,470 | $12,600 | $60,870 |
| 2017 | $4,114 | $73,470 | $12,600 | $60,870 |
| 2016 | $4,145 | $61,220 | $10,500 | $50,720 |
| 2015 | $3,838 | $61,220 | $10,500 | $50,720 |
| 2014 | $3,838 | $61,220 | $10,500 | $50,720 |
| 2013 | $3,815 | $59,010 | $11,200 | $47,810 |
Source: Public Records
Map
Nearby Homes
- 2013 Weber Rd
- 1140 Weber Rd
- 1803 Wheatfield Way
- 5933 Firm Stance Dr
- 6211 Spires Dr
- 6108 Donna Jay Dr
- 6149 Century Farm Dr
- 6320 Ashford Dr
- 6141 Brandywine Ct
- 1064 Weber Rd
- 1376 Barre Ln
- 1124 Clover Field Dr
- 6395 Barre Rd
- 6467 Smith Rd
- 1113 Clover Field Dr
- 1513 Charleston Ln
- 6379 Derbyshire Ln
- 6077 Branch Hill Guinea Pike
- 6211 Cook Rd
- 1285 State Rte 28
- 1524 Summit Ridge Rd
- 1528 Summit Ridge Rd
- 1522 Summit Ridge Rd
- 1530 Summit Ridge Rd
- 1535 Summit Ridge
- 1520 Summit Ridge
- 1535 Summit Ridge Rd
- 1520 Summit Ridge Rd
- 2004 Weber Rd
- 1532 Summit Ridge Rd
- 2006 Weber Rd
- 1533 Summit Ridge Rd
- 1531 Summit Ridge
- 2002 Weber Rd
- 1537 Summit Ridge Rd
- 1532 Summit Ridge
- 1531 Summit Ridge Rd
- 2000 Weber Rd
- 1518 Summit Ridge Rd
- 1529 Summit Ridge Rd