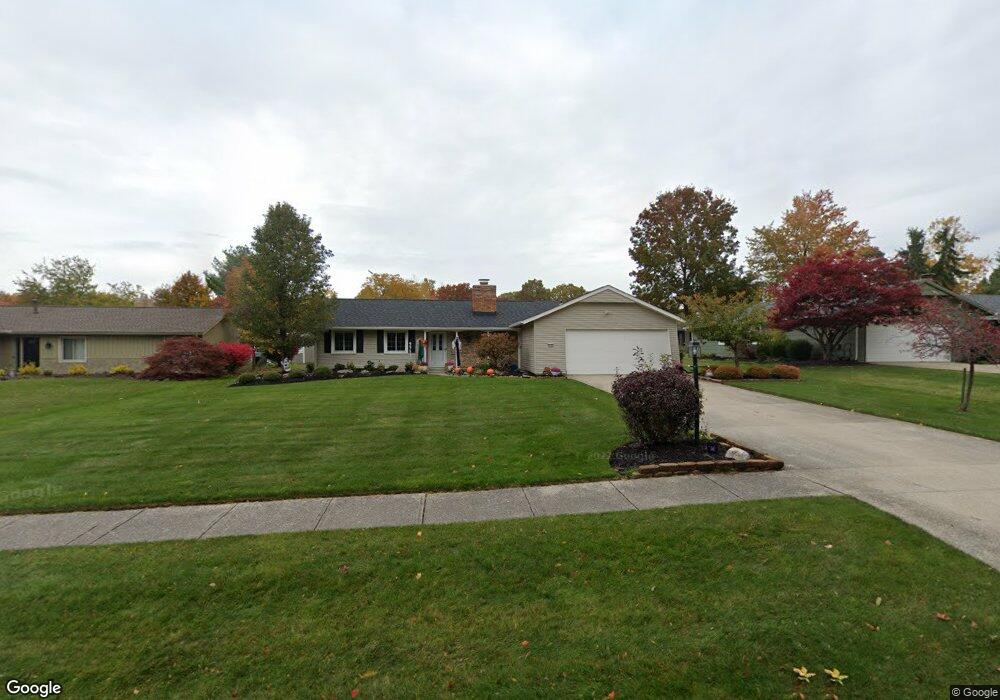
15262 High Point Strongsville, OH 44136
Estimated Value: $303,366 - $326,000
3
Beds
2
Baths
1,710
Sq Ft
$185/Sq Ft
Est. Value
About This Home
This home is located at 15262 High Point, Strongsville, OH 44136 and is currently estimated at $316,592, approximately $185 per square foot. 15262 High Point is a home located in Cuyahoga County with nearby schools including Strongsville High School, Royal Redeemer Lutheran School, and Sts Joseph & John Interparochial School.
Ownership History
Date
Name
Owned For
Owner Type
Purchase Details
Closed on
Oct 6, 1995
Sold by
Perez Raul
Bought by
Rees Robert G and Rees Janet L
Current Estimated Value
Home Financials for this Owner
Home Financials are based on the most recent Mortgage that was taken out on this home.
Original Mortgage
$122,550
Interest Rate
7.91%
Mortgage Type
New Conventional
Purchase Details
Closed on
Nov 8, 1991
Sold by
Stallons Mark A
Bought by
Perez Raul
Purchase Details
Closed on
Aug 22, 1988
Sold by
Feverston Mark and Feverston Tammy
Bought by
Stallons Mark A
Purchase Details
Closed on
Jul 31, 1986
Sold by
Smyth Arthur P
Bought by
Feverston Mark and Feverston Tammy
Purchase Details
Closed on
Jul 2, 1980
Sold by
Lawless Richard H and L L
Bought by
Smyth Arthur P
Purchase Details
Closed on
Jan 1, 1975
Bought by
Lawless Richard H and L L
Create a Home Valuation Report for This Property
The Home Valuation Report is an in-depth analysis detailing your home's value as well as a comparison with similar homes in the area
Home Values in the Area
Average Home Value in this Area
Purchase History
| Date | Buyer | Sale Price | Title Company |
|---|---|---|---|
| Rees Robert G | $129,000 | -- | |
| Perez Raul | $111,000 | -- | |
| Stallons Mark A | $104,000 | -- | |
| Feverston Mark | $86,000 | -- | |
| Smyth Arthur P | $77,500 | -- | |
| Lawless Richard H | -- | -- |
Source: Public Records
Mortgage History
| Date | Status | Borrower | Loan Amount |
|---|---|---|---|
| Closed | Rees Robert G | $122,550 |
Source: Public Records
Tax History
| Year | Tax Paid | Tax Assessment Tax Assessment Total Assessment is a certain percentage of the fair market value that is determined by local assessors to be the total taxable value of land and additions on the property. | Land | Improvement |
|---|---|---|---|---|
| 2025 | $3,717 | $89,320 | $20,650 | $68,670 |
| 2024 | $3,733 | $89,320 | $20,650 | $68,670 |
| 2023 | $3,768 | $69,340 | $17,820 | $51,520 |
| 2022 | $3,766 | $69,335 | $17,815 | $51,520 |
| 2021 | $3,737 | $69,340 | $17,820 | $51,520 |
| 2020 | $3,453 | $58,280 | $14,980 | $43,300 |
| 2019 | $3,351 | $166,500 | $42,800 | $123,700 |
| 2018 | $3,042 | $58,280 | $14,980 | $43,300 |
| 2017 | $2,949 | $53,200 | $12,810 | $40,390 |
| 2016 | $2,925 | $53,200 | $12,810 | $40,390 |
| 2015 | $2,864 | $53,200 | $12,810 | $40,390 |
| 2014 | $2,864 | $51,670 | $12,430 | $39,240 |
Source: Public Records
Map
Nearby Homes
- 0 Webster Rd
- 14292 Bentley Ln
- 14557 Baywood Ln
- 14655 Baywood Ln
- 10388 Webster Rd
- 9809 Brookline Oval
- 9841 Brookline Oval
- 16912 Albion Rd
- 14193 Fernwood Cir
- 15852 Inglewood Ct
- 9890 Webster Rd
- 12101 The Bluffs
- 9898 Lakeview Cir
- 12894 Falling Water Rd
- 17338 Ridge Creek Rd
- 10134 Rosalee Ln
- 16225 Lakeforest Dr
- 17833 Cliffside Dr Unit 4929
- 17291 Iyami Ct
- 18175 Trailside Place
- 15258 High Point
- 15266 High Point
- 15263 Forest Park Dr
- 15254 High Point
- 15259 Forest Park Dr
- 15267 Forest Park Dr
- 15254 High Point Rd
- 15261 High Point
- 15255 Forest Park Dr
- 11647 Forest Point Place
- 15265 High Point
- 15250 High Point
- 11700 Park Point
- 11710 Park Point
- 11702 Park Point
- 11706 Park Point
- 15251 Forest Park Dr
- 15253 High Point
- 11711 Park Point
- 11643 Forest Point Place
Your Personal Tour Guide
Ask me questions while you tour the home.