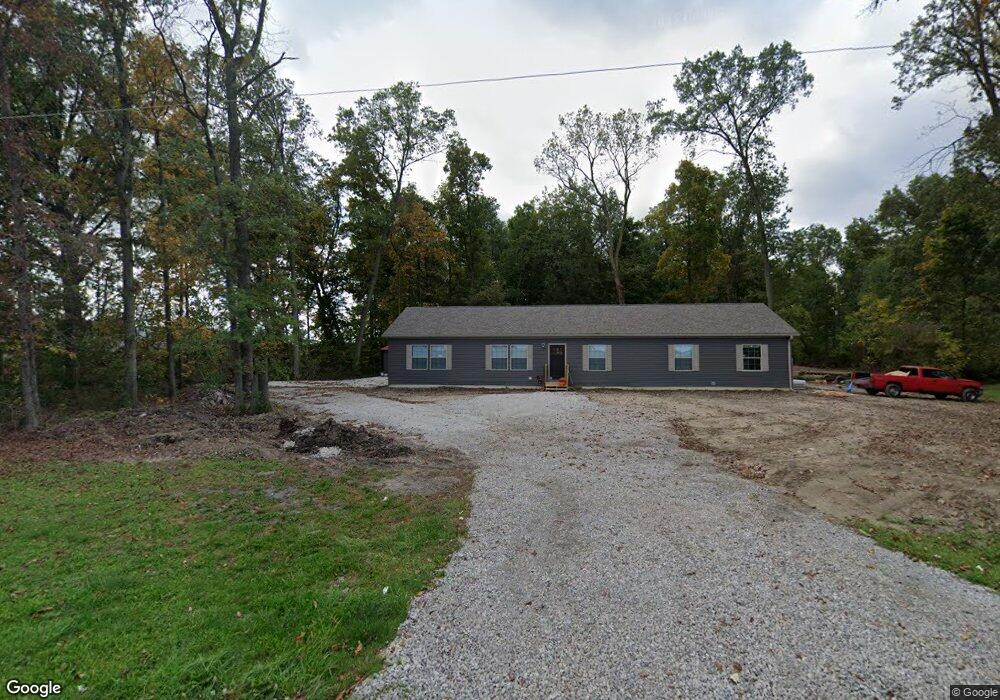
15263 Cross Creek Rd Bowling Green, OH 43402
Estimated Value: $251,000 - $428,000
3
Beds
1
Bath
1,459
Sq Ft
$231/Sq Ft
Est. Value
About This Home
This home is located at 15263 Cross Creek Rd, Bowling Green, OH 43402 and is currently estimated at $337,219, approximately $231 per square foot. 15263 Cross Creek Rd is a home located in Wood County with nearby schools including Otsego Elementary School, Otsego Junior High School, and Otsego High School.
Ownership History
Date
Name
Owned For
Owner Type
Purchase Details
Closed on
May 12, 2023
Sold by
Spaulding Scott Arthur
Bought by
Spaulding Irrevocable Heritage Trust
Current Estimated Value
Purchase Details
Closed on
May 14, 2021
Sold by
Spaulding Scott
Bought by
Spaulding Scott Arthur and Scott Arthur Spaudling Living
Purchase Details
Closed on
Oct 17, 2013
Sold by
Anderson Brittany
Bought by
Spaulding Scott
Purchase Details
Closed on
Jul 22, 2010
Sold by
Myers Mary J and Myers Michael
Bought by
Anderson Brittany
Purchase Details
Closed on
Jul 20, 2010
Sold by
Fleming Robert W
Bought by
Anderson Brittany
Purchase Details
Closed on
Jul 19, 2010
Sold by
Tietje Evelyn L and Tietje Robert
Bought by
Anderson Brittany
Purchase Details
Closed on
Jun 25, 2010
Sold by
Estate Of Mary Margaret Fleming
Bought by
Fleming Robert W
Purchase Details
Closed on
Jul 23, 1987
Bought by
Fleming Mary M
Create a Home Valuation Report for This Property
The Home Valuation Report is an in-depth analysis detailing your home's value as well as a comparison with similar homes in the area
Home Values in the Area
Average Home Value in this Area
Purchase History
| Date | Buyer | Sale Price | Title Company |
|---|---|---|---|
| Spaulding Irrevocable Heritage Trust | -- | None Listed On Document | |
| Spaulding Scott Arthur | -- | None Listed On Document | |
| Spaulding Scott Arthur | -- | None Available | |
| Spaulding Scott | -- | None Available | |
| Anderson Brittany | $12,400 | Attorney | |
| Anderson Brittany | $12,400 | Attorney | |
| Tietje Evelyn L | -- | None Available | |
| Anderson Brittany | $12,400 | Attorney | |
| Fleming Robert W | -- | None Available | |
| Fleming Mary M | -- | -- |
Source: Public Records
Tax History Compared to Growth
Tax History
| Year | Tax Paid | Tax Assessment Tax Assessment Total Assessment is a certain percentage of the fair market value that is determined by local assessors to be the total taxable value of land and additions on the property. | Land | Improvement |
|---|---|---|---|---|
| 2024 | $4,236 | $103,775 | $18,795 | $84,980 |
| 2023 | $4,236 | $103,780 | $18,800 | $84,980 |
| 2022 | $2,874 | $63,250 | $13,340 | $49,910 |
| 2021 | $837 | $18,630 | $13,340 | $5,290 |
| 2020 | $860 | $18,630 | $13,340 | $5,290 |
| 2019 | $837 | $17,610 | $13,160 | $4,450 |
| 2018 | $833 | $17,610 | $13,160 | $4,450 |
| 2017 | $732 | $17,610 | $13,160 | $4,450 |
| 2016 | $625 | $13,620 | $12,010 | $1,610 |
| 2015 | $625 | $13,620 | $12,010 | $1,610 |
| 2014 | $647 | $13,620 | $12,010 | $1,610 |
| 2013 | $713 | $13,620 | $12,010 | $1,610 |
Source: Public Records
Map
Nearby Homes
- 19537 Liberty Hi Rd
- 104 E Main St
- 109 High St
- 19877 N Dixie Hwy
- 1810 Wicklow Dr
- 1723 Wexford
- Limerick Plan at Northwest Ohio Collection
- Canterbury Plan at Northwest Ohio Collection
- 24577 W 3rd St
- Goldenrod Plan at Northwest Ohio Collection
- Barcelona Plan at Northwest Ohio Collection
- Oleander Plan at Northwest Ohio Collection
- Water Lily Plan at Northwest Ohio Collection
- 24557 W 3rd St
- 24537 W 3rd St
- 18142 Tontogany Rd
- 18555 Crom St
- 0 Wall St
- 135 Coach House Loop
- 140 Coach House Loop
- 14140 Cross Creek Rd
- 17714 Cross Creek Rd
- 15153 Cross Creek Rd
- 15321 Cross Creek Rd
- 15233 Cross Creek Rd
- 15228 Cross Creek Rd
- 15228 Cross Creek Rd
- 15361 Cross Creek Rd
- 15151 Cross Creek Rd
- 19490 Haskins Rd
- 19410 Haskins Rd
- 15119 Cross Creek Rd
- 19337 Haskins Rd
- 15085 Cross Creek Rd
- 19625 Asmus Rd
- 14955 Cross Creek Rd
- 19210 Haskins Rd
- 14909 Cross Creek Rd
- 14667 Cross Creek Rd
- 20113 Haskins Rd