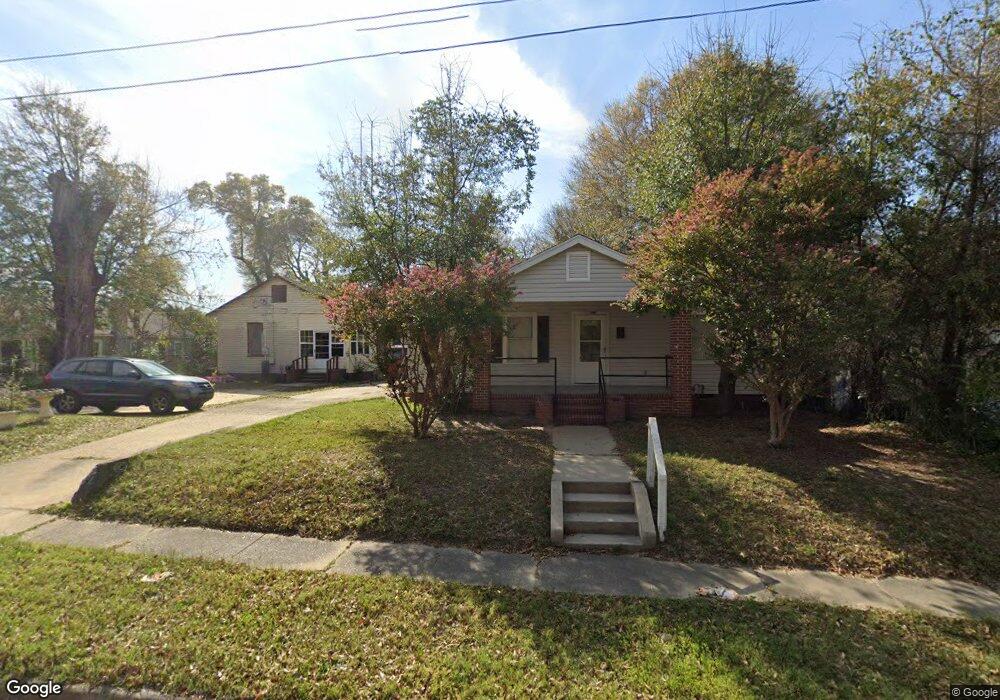
1527 11th Ave Columbus, GA 31901
East Highlands NeighborhoodEstimated Value: $65,812 - $115,000
2
Beds
2
Baths
850
Sq Ft
$97/Sq Ft
Est. Value
About This Home
This home is located at 1527 11th Ave, Columbus, GA 31901 and is currently estimated at $82,453, approximately $97 per square foot. 1527 11th Ave is a home located in Muscogee County with nearby schools including Double Churches Middle School, Jordan Vocational High School, and Wynnton Elementary School.
Ownership History
Date
Name
Owned For
Owner Type
Purchase Details
Closed on
Sep 18, 2024
Sold by
B4i Group Llc
Bought by
11Th Av Columbus Llc
Current Estimated Value
Purchase Details
Closed on
Aug 8, 2022
Sold by
Grant Living Llc
Bought by
B4i Group Llc
Purchase Details
Closed on
Nov 18, 2021
Sold by
Kindrick Michael E
Bought by
Figueroa Jose V
Create a Home Valuation Report for This Property
The Home Valuation Report is an in-depth analysis detailing your home's value as well as a comparison with similar homes in the area
Home Values in the Area
Average Home Value in this Area
Purchase History
| Date | Buyer | Sale Price | Title Company |
|---|---|---|---|
| 11Th Av Columbus Llc | -- | None Listed On Document | |
| B4i Group Llc | $57,000 | None Listed On Document | |
| Grant Living Llc | $50,000 | None Listed On Document | |
| Figueroa Jose V | -- | -- |
Source: Public Records
Tax History
| Year | Tax Paid | Tax Assessment Tax Assessment Total Assessment is a certain percentage of the fair market value that is determined by local assessors to be the total taxable value of land and additions on the property. | Land | Improvement |
|---|---|---|---|---|
| 2025 | $1,199 | $30,624 | $8,264 | $22,360 |
| 2024 | $1,199 | $30,624 | $8,264 | $22,360 |
| 2023 | $898 | $22,800 | $7,520 | $15,280 |
| 2022 | $738 | $18,080 | $8,264 | $9,816 |
| 2021 | $813 | $19,920 | $8,264 | $11,656 |
| 2020 | $814 | $19,920 | $8,264 | $11,656 |
| 2019 | $816 | $19,920 | $8,264 | $11,656 |
| 2018 | $816 | $19,920 | $8,264 | $11,656 |
| 2017 | $819 | $19,920 | $8,264 | $11,656 |
| 2016 | $603 | $14,613 | $2,090 | $12,523 |
| 2015 | $604 | $14,613 | $2,090 | $12,523 |
| 2014 | $604 | $14,613 | $2,090 | $12,523 |
| 2013 | -- | $14,613 | $2,090 | $12,523 |
Source: Public Records
Map
Nearby Homes
Your Personal Tour Guide
Ask me questions while you tour the home.