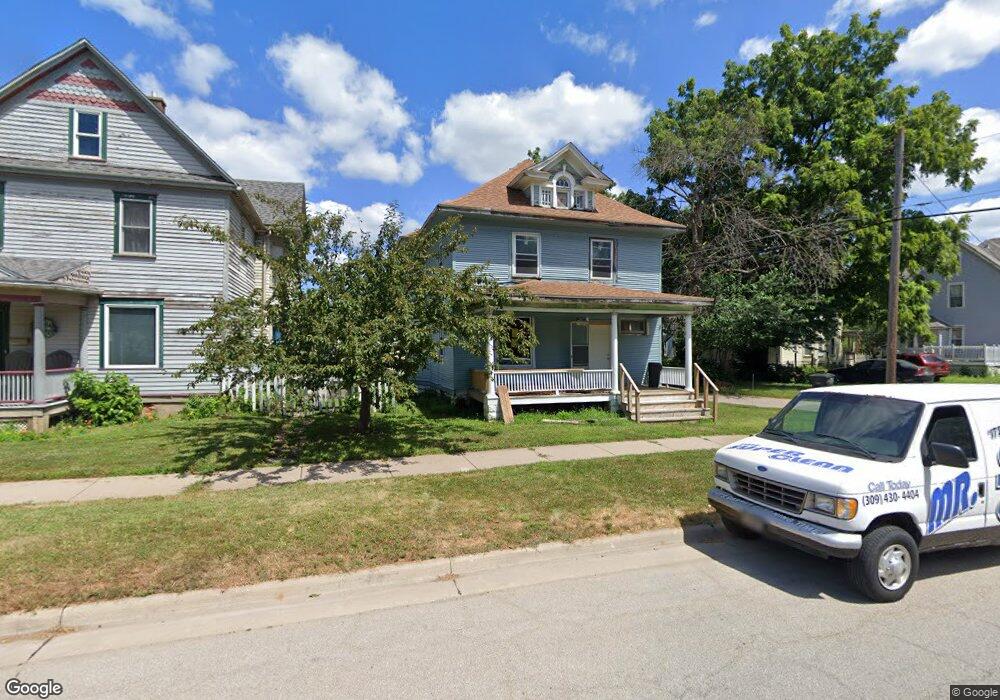
1527 9th Ave Rock Island, IL 61201
Longview NeighborhoodEstimated Value: $55,009 - $83,000
--
Bed
--
Bath
1,604
Sq Ft
$43/Sq Ft
Est. Value
About This Home
This home is located at 1527 9th Ave, Rock Island, IL 61201 and is currently estimated at $69,252, approximately $43 per square foot. 1527 9th Ave is a home located in Rock Island County with nearby schools including Rock Island Academy, Washington Junior High School, and Rock Island High School.
Ownership History
Date
Name
Owned For
Owner Type
Purchase Details
Closed on
Mar 21, 2018
Sold by
Dwight Bailey
Bought by
Husseini Issa
Current Estimated Value
Purchase Details
Closed on
Dec 14, 2017
Sold by
Trust No 09 39990735310052
Bought by
Morney Tremere A and Bailey Dwight L
Purchase Details
Closed on
Nov 6, 2017
Sold by
County Of Rock Island
Bought by
Trust No 09 3999 0735310052
Create a Home Valuation Report for This Property
The Home Valuation Report is an in-depth analysis detailing your home's value as well as a comparison with similar homes in the area
Home Values in the Area
Average Home Value in this Area
Purchase History
| Date | Buyer | Sale Price | Title Company |
|---|---|---|---|
| Husseini Issa | $18,000 | -- | |
| Morney Tremere A | -- | Schrimpf Stephen P | |
| Trust No 09 3999 0735310052 | -- | Schrimpf Stephen P |
Source: Public Records
Tax History Compared to Growth
Tax History
| Year | Tax Paid | Tax Assessment Tax Assessment Total Assessment is a certain percentage of the fair market value that is determined by local assessors to be the total taxable value of land and additions on the property. | Land | Improvement |
|---|---|---|---|---|
| 2024 | $1,561 | $15,302 | $1,222 | $14,080 |
| 2023 | $1,561 | $14,601 | $1,166 | $13,435 |
| 2022 | $1,406 | $13,551 | $1,095 | $12,456 |
| 2021 | $1,392 | $13,005 | $1,051 | $11,954 |
| 2020 | $1,374 | $12,687 | $1,025 | $11,662 |
| 2019 | $1,373 | $12,687 | $1,025 | $11,662 |
| 2018 | $1,321 | $12,438 | $1,005 | $11,433 |
| 2017 | $1,233 | $0 | $0 | $0 |
| 2016 | $1,233 | $12,014 | $971 | $11,043 |
| 2015 | $1,183 | $11,387 | $920 | $10,467 |
| 2014 | $236 | $16,207 | $910 | $15,297 |
| 2013 | $236 | $16,207 | $910 | $15,297 |
Source: Public Records
Map
Nearby Homes