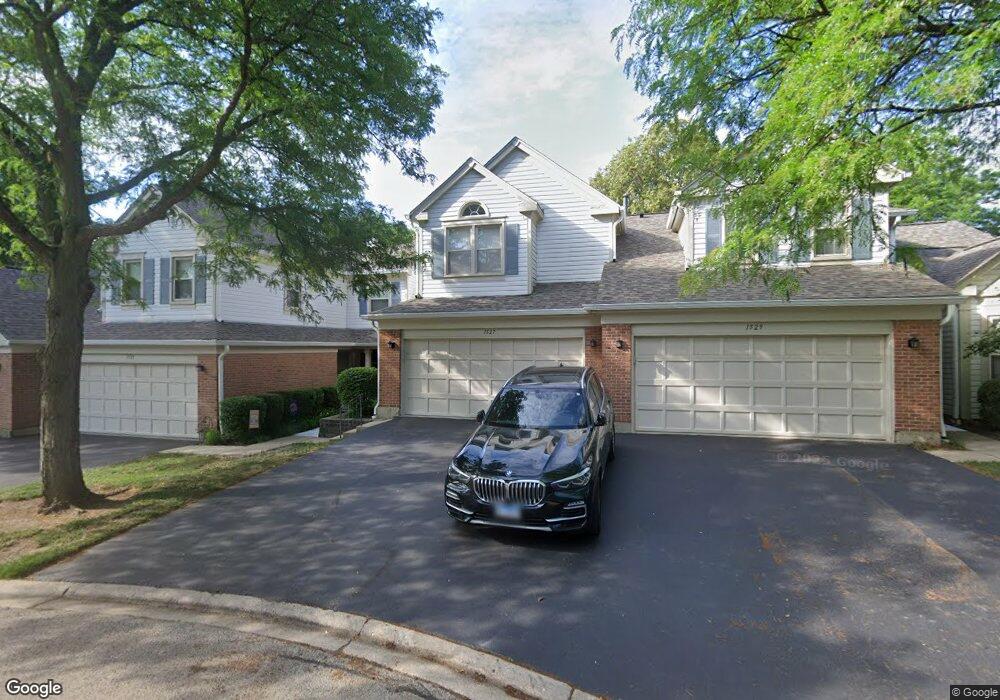
1527 Acorn Ct Unit 1990N Wheeling, IL 60090
Estimated Value: $251,000 - $471,000
2
Beds
3
Baths
1,800
Sq Ft
$218/Sq Ft
Est. Value
About This Home
This home is located at 1527 Acorn Ct Unit 1990N, Wheeling, IL 60090 and is currently estimated at $391,974, approximately $217 per square foot. 1527 Acorn Ct Unit 1990N is a home located in Cook County with nearby schools including Joyce Kilmer Elementary School, Cooper Middle School, and Buffalo Grove High School.
Ownership History
Date
Name
Owned For
Owner Type
Purchase Details
Closed on
Dec 19, 2011
Sold by
Boldun Marko and Degtyareva Izabella
Bought by
Fleyshov Dmitriy and Fleyshov Margarita
Current Estimated Value
Home Financials for this Owner
Home Financials are based on the most recent Mortgage that was taken out on this home.
Original Mortgage
$172,000
Outstanding Balance
$117,660
Interest Rate
4.01%
Mortgage Type
New Conventional
Estimated Equity
$274,314
Purchase Details
Closed on
Oct 20, 2000
Sold by
Field Alex
Bought by
Field Elaine
Home Financials for this Owner
Home Financials are based on the most recent Mortgage that was taken out on this home.
Original Mortgage
$186,400
Interest Rate
7.87%
Purchase Details
Closed on
Dec 18, 1995
Sold by
Smith Justine T
Bought by
Boldun Marko and Degtyareva Izabella
Create a Home Valuation Report for This Property
The Home Valuation Report is an in-depth analysis detailing your home's value as well as a comparison with similar homes in the area
Home Values in the Area
Average Home Value in this Area
Purchase History
| Date | Buyer | Sale Price | Title Company |
|---|---|---|---|
| Fleyshov Dmitriy | $215,000 | Republic Title Co | |
| Field Elaine | -- | -- | |
| Boldun Marko | $184,000 | Ticor Title Insurance |
Source: Public Records
Mortgage History
| Date | Status | Borrower | Loan Amount |
|---|---|---|---|
| Open | Fleyshov Dmitriy | $172,000 | |
| Previous Owner | Field Elaine | $186,400 |
Source: Public Records
Tax History Compared to Growth
Tax History
| Year | Tax Paid | Tax Assessment Tax Assessment Total Assessment is a certain percentage of the fair market value that is determined by local assessors to be the total taxable value of land and additions on the property. | Land | Improvement |
|---|---|---|---|---|
| 2024 | $9,380 | $31,306 | $6,404 | $24,902 |
| 2023 | $10,006 | $31,306 | $6,404 | $24,902 |
| 2022 | $10,006 | $31,306 | $6,404 | $24,902 |
| 2021 | $8,757 | $26,965 | $1,067 | $25,898 |
| 2020 | $9,731 | $26,965 | $1,067 | $25,898 |
| 2019 | $9,888 | $30,176 | $1,067 | $29,109 |
| 2018 | $8,452 | $23,160 | $853 | $22,307 |
| 2017 | $8,280 | $23,160 | $853 | $22,307 |
| 2016 | $7,727 | $23,160 | $853 | $22,307 |
| 2015 | $6,652 | $18,669 | $3,628 | $15,041 |
| 2014 | $6,489 | $18,669 | $3,628 | $15,041 |
| 2013 | $5,991 | $18,669 | $3,628 | $15,041 |
Source: Public Records
Map
Nearby Homes
- 1500 Canbury Ct Unit 11373
- 1600 Brittany Ct Unit C-2
- 51 Old Oak Dr Unit 414
- 10 Old Oak Dr Unit 103
- 586 Fairway View Dr Unit 1A
- 577 Fairway View Dr Unit 1J
- 588 Fairway View Dr Unit 2E
- 400 E Dundee Rd Unit 207C
- 100 Lake Blvd Unit 603
- 50 Lake Blvd Unit 632
- 250 Lake Blvd Unit 218
- 10 Oak Creek Dr Unit 1020
- 150 Lake Blvd Unit 125
- 8 Oak Creek Dr Unit 1803
- 7 Oak Creek Dr Unit 3703
- 1242 Nova Ct Unit 24
- 416 Trinity Ct
- 1239 Oboe Ct Unit 33
- 200 Lake Blvd Unit 402
- 200 Lake Blvd Unit 439
- 1529 Acorn Ct Unit 1990O
- 1529 Acorn Ct Unit O
- 1525 Acorn Ct Unit 1990N
- 1523 Acorn Ct Unit 1990L
- 1521 Acorn Ct Unit 1989N
- 1517 Acorn Ct Unit 1989O
- 1519 Acorn Ct Unit 1989N
- 1503 Acorn Ct Unit 1787N
- 1501 Acorn Ct Unit 1787L
- 1501 Acorn Ct Unit L
- 1505 Acorn Ct Unit 1787N
- 1511 Acorn Ct Unit 1988N
- 1507 Acorn Ct Unit 1787O
- 1513 Acorn Ct Unit 1988N
- 1509 Acorn Ct Unit 1988L
- 1600 Warwick Ct Unit C1
- 1600 Warwick Ct Unit 1648L
- 1600 Warwick Ct Unit 1648L
- 1600 Warwick Ct Unit 1648L
- 1600 Warwick Ct Unit 1648L