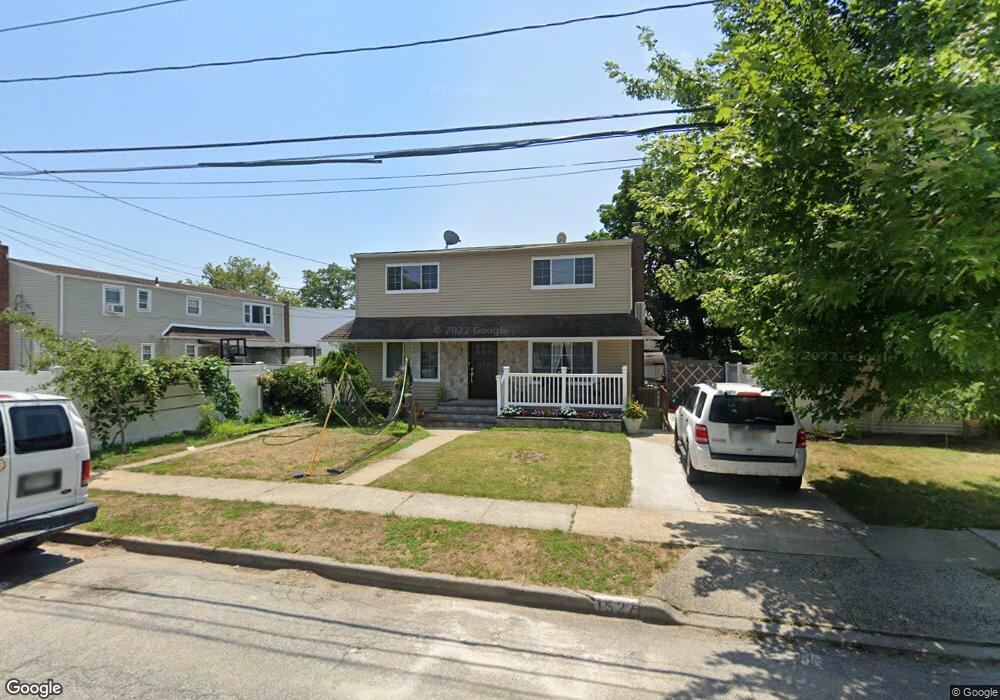
1527 Clay St Elmont, NY 11003
Estimated Value: $679,128 - $737,000
--
Bed
2
Baths
1,447
Sq Ft
$489/Sq Ft
Est. Value
About This Home
This home is located at 1527 Clay St, Elmont, NY 11003 and is currently estimated at $708,064, approximately $489 per square foot. 1527 Clay St is a home located in Nassau County with nearby schools including Our Lady Of Victory School.
Ownership History
Date
Name
Owned For
Owner Type
Purchase Details
Closed on
Apr 17, 2017
Sold by
1527 Clay Corp
Bought by
Raza Ali
Current Estimated Value
Home Financials for this Owner
Home Financials are based on the most recent Mortgage that was taken out on this home.
Original Mortgage
$382,000
Outstanding Balance
$318,661
Interest Rate
4.3%
Mortgage Type
New Conventional
Estimated Equity
$389,403
Purchase Details
Closed on
Dec 20, 2016
Sold by
Puertas Juan A
Bought by
1527 Clay Corp
Purchase Details
Closed on
Jul 21, 2008
Sold by
Pighini Thomas
Bought by
Puertas Juan
Purchase Details
Closed on
Feb 17, 2005
Sold by
Reynolds Bruce
Bought by
Pighini Thomas
Create a Home Valuation Report for This Property
The Home Valuation Report is an in-depth analysis detailing your home's value as well as a comparison with similar homes in the area
Home Values in the Area
Average Home Value in this Area
Purchase History
| Date | Buyer | Sale Price | Title Company |
|---|---|---|---|
| Raza Ali | $427,500 | None Available | |
| 1527 Clay Corp | $259,786 | Highland Title Insurance Age | |
| Puertas Juan | $439,000 | -- | |
| Pighini Thomas | $505,000 | -- |
Source: Public Records
Mortgage History
| Date | Status | Borrower | Loan Amount |
|---|---|---|---|
| Open | Raza Ali | $382,000 |
Source: Public Records
Tax History Compared to Growth
Tax History
| Year | Tax Paid | Tax Assessment Tax Assessment Total Assessment is a certain percentage of the fair market value that is determined by local assessors to be the total taxable value of land and additions on the property. | Land | Improvement |
|---|---|---|---|---|
| 2025 | $13,006 | $504 | $254 | $250 |
| 2024 | $3,730 | $476 | $232 | $244 |
| 2023 | $11,397 | $526 | $255 | $271 |
| 2022 | $11,397 | $522 | $254 | $268 |
| 2021 | $13,792 | $553 | $269 | $284 |
| 2020 | $10,883 | $599 | $486 | $113 |
| 2019 | $9,954 | $865 | $675 | $190 |
| 2018 | $13,694 | $865 | $0 | $0 |
| 2017 | $8,325 | $865 | $675 | $190 |
| 2016 | $12,569 | $865 | $675 | $190 |
| 2015 | $3,942 | $865 | $675 | $190 |
| 2014 | $3,942 | $865 | $675 | $190 |
| 2013 | $3,696 | $865 | $675 | $190 |
Source: Public Records
Map
Nearby Homes