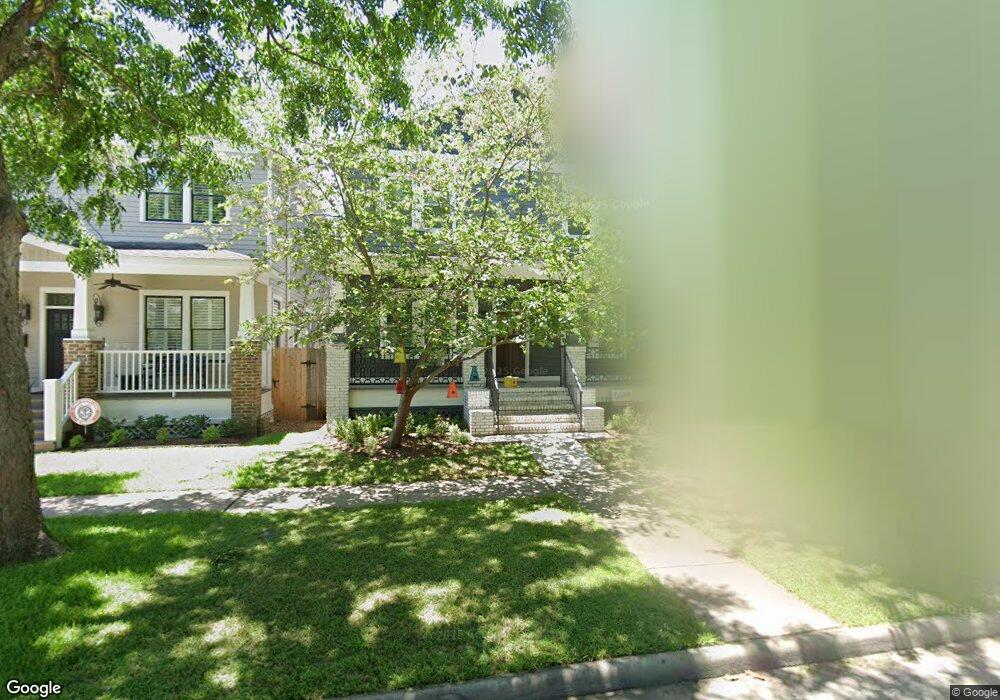
1527 Oxford St Houston, TX 77008
Greater Heights NeighborhoodEstimated Value: $551,000 - $1,161,000
3
Beds
4
Baths
2,560
Sq Ft
$330/Sq Ft
Est. Value
About This Home
This home is located at 1527 Oxford St, Houston, TX 77008 and is currently estimated at $844,564, approximately $329 per square foot. 1527 Oxford St is a home located in Harris County with nearby schools including Field Elementary School, Hamilton Middle, and Heights High School.
Ownership History
Date
Name
Owned For
Owner Type
Purchase Details
Closed on
Jan 18, 2024
Sold by
Scoulios Thomas Elias and Scoulios Claire Bonis
Bought by
Tco Living Trust and Scoulios
Current Estimated Value
Purchase Details
Closed on
Oct 3, 2012
Sold by
Rollans Rob
Bought by
Certified Funding and Scoulios
Home Financials for this Owner
Home Financials are based on the most recent Mortgage that was taken out on this home.
Original Mortgage
$417,000
Interest Rate
3.7%
Mortgage Type
New Conventional
Purchase Details
Closed on
Jun 29, 2007
Sold by
1525 Oxford Lp
Bought by
Rollans Rob
Home Financials for this Owner
Home Financials are based on the most recent Mortgage that was taken out on this home.
Original Mortgage
$417,000
Interest Rate
6.19%
Mortgage Type
Purchase Money Mortgage
Create a Home Valuation Report for This Property
The Home Valuation Report is an in-depth analysis detailing your home's value as well as a comparison with similar homes in the area
Home Values in the Area
Average Home Value in this Area
Purchase History
| Date | Buyer | Sale Price | Title Company |
|---|---|---|---|
| Tco Living Trust | -- | None Listed On Document | |
| Scoulios Thomas E | -- | None Listed On Document | |
| Certified Funding | -- | Charter Title Company | |
| Certified Funding | -- | Charter Title Company | |
| Rollans Rob | -- | Partners Title Company |
Source: Public Records
Mortgage History
| Date | Status | Borrower | Loan Amount |
|---|---|---|---|
| Previous Owner | Certified Funding | $417,000 | |
| Previous Owner | Rollans Rob | $417,000 |
Source: Public Records
Tax History Compared to Growth
Tax History
| Year | Tax Paid | Tax Assessment Tax Assessment Total Assessment is a certain percentage of the fair market value that is determined by local assessors to be the total taxable value of land and additions on the property. | Land | Improvement |
|---|---|---|---|---|
| 2025 | $17,922 | $1,247,873 | $445,500 | $802,373 |
| 2024 | $17,922 | $1,120,643 | $445,500 | $675,143 |
| 2023 | $17,922 | $1,024,776 | $445,500 | $579,276 |
| 2022 | $23,615 | $1,090,000 | $346,500 | $743,500 |
| 2021 | $22,724 | $975,000 | $346,500 | $628,500 |
| 2020 | $23,538 | $972,000 | $346,500 | $625,500 |
| 2019 | $22,433 | $886,510 | $321,750 | $564,760 |
| 2018 | $16,244 | $813,299 | $297,000 | $516,299 |
| 2017 | $19,247 | $813,299 | $297,000 | $516,299 |
| 2016 | $17,498 | $691,995 | $168,750 | $523,245 |
| 2015 | $12,906 | $698,943 | $168,750 | $530,193 |
| 2014 | $12,906 | $658,445 | $168,750 | $489,695 |
Source: Public Records
Map
Nearby Homes
- 607 E 15th St
- 1611 Columbia St
- 1445 Hall Place
- 710 Le Green St
- 710 E 18th St
- 1819 Oxford St
- 1436 Harvard St
- 768 E 16th St
- 1369 Arlington St Unit 1369
- 1377 Arlington St Unit 1377
- 1397 Arlington St Unit 1397
- 1823 Arlington St
- 1131 Walling St
- 1846 Arlington St
- 1819 Cortlandt St
- 4601 Oak Ridge St
- 121 E 18th St
- 105 E 14th St
- 1811 & 1815 Studewood St
- 1133 E 14th St
- 1525 Oxford St
- 1531 Oxford St
- 1523 Oxford St
- 1519 Oxford St
- 1524 Columbia St
- 1524 Columbia St Unit A
- 662.5 Peddie
- 1536 Columbia St
- 1536 Columbia St Unit 1/2
- 1522 Columbia St
- 1538 Columbia St
- 1528 Oxford St
- 1520 Columbia St
- 1515 Oxford St
- 1540 Columbia St
- 1545 Oxford St
- 1540 Oxford St
- 605 Peddie St
- 600 Peddie St
- 1509 Oxford St