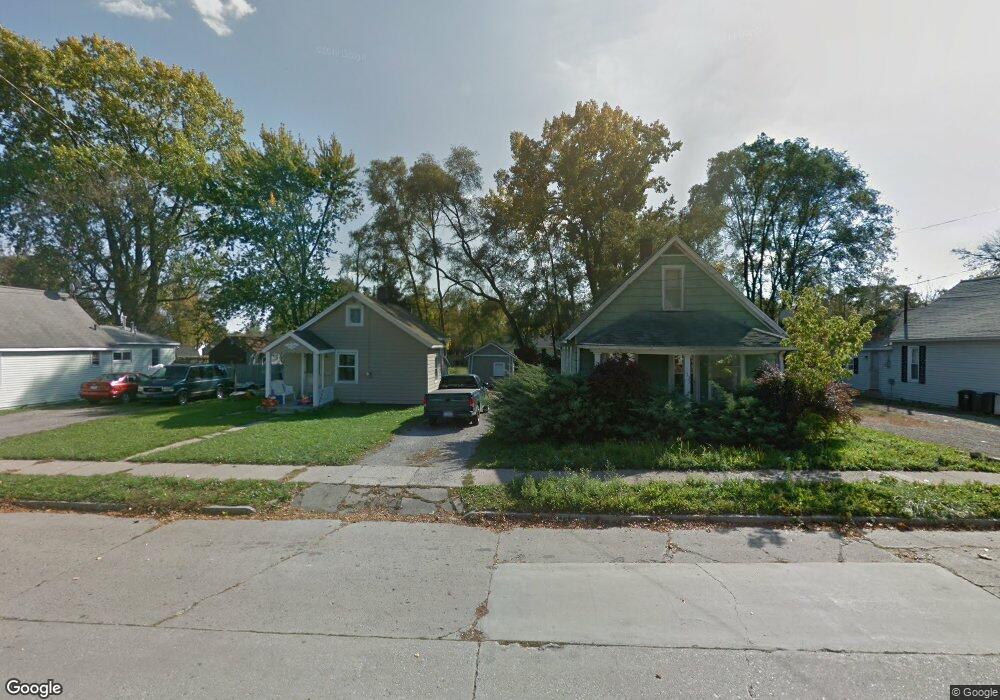
1527 Stanley St Saginaw, MI 48602
Southwest NeighborhoodEstimated Value: $16,000 - $70,000
2
Beds
1
Bath
585
Sq Ft
$70/Sq Ft
Est. Value
About This Home
This home is located at 1527 Stanley St, Saginaw, MI 48602 and is currently estimated at $40,757, approximately $69 per square foot. 1527 Stanley St is a home located in Saginaw County with nearby schools including Merrill Park Elementary School, Thompson Middle School, and Arthur Hill High School.
Ownership History
Date
Name
Owned For
Owner Type
Purchase Details
Closed on
Feb 21, 2025
Sold by
C & P Investments Llc
Bought by
Kf Roth Llc
Current Estimated Value
Purchase Details
Closed on
Feb 14, 2014
Sold by
Saginaw Oaks Llc
Bought by
C & P Investments
Purchase Details
Closed on
Jul 28, 2000
Sold by
Dept Of Natural Resources-00
Bought by
Haman Michael C
Purchase Details
Closed on
May 2, 2000
Sold by
Haman Michael C and Haman Jill L
Bought by
Dept Of Natural Resources-00
Purchase Details
Closed on
Mar 11, 1998
Sold by
Love Jill L
Bought by
Haman Michael C
Purchase Details
Closed on
Jan 10, 1990
Sold by
Haman Michael C and Jill Love-
Bought by
Haman Michael C and Jill Love-
Purchase Details
Closed on
May 5, 1986
Sold by
Family Federal Sabings & Loan
Bought by
Haman Michael C
Purchase Details
Closed on
Jan 22, 1986
Sold by
Mann James H
Bought by
Family Federal Savings & Loan
Purchase Details
Closed on
May 15, 1981
Sold by
Mann James H and Mann Iris J
Bought by
Mann Patricia A
Create a Home Valuation Report for This Property
The Home Valuation Report is an in-depth analysis detailing your home's value as well as a comparison with similar homes in the area
Home Values in the Area
Average Home Value in this Area
Purchase History
| Date | Buyer | Sale Price | Title Company |
|---|---|---|---|
| Kf Roth Llc | $15,000 | Diversified National Title | |
| C & P Investments | -- | -- | |
| Haman Michael C | -- | -- | |
| Dept Of Natural Resources-00 | -- | -- | |
| Haman Michael C | -- | -- | |
| Haman Michael C | -- | -- | |
| Haman Michael C | -- | -- | |
| Haman Michael C | $5,500 | -- | |
| Family Federal Savings & Loan | $8,400 | -- | |
| Mann Patricia A | -- | -- |
Source: Public Records
Tax History Compared to Growth
Tax History
| Year | Tax Paid | Tax Assessment Tax Assessment Total Assessment is a certain percentage of the fair market value that is determined by local assessors to be the total taxable value of land and additions on the property. | Land | Improvement |
|---|---|---|---|---|
| 2025 | $539 | $12,300 | $0 | $0 |
| 2024 | $441 | $11,200 | $0 | $0 |
| 2023 | $767 | $9,700 | $0 | $0 |
| 2022 | $494 | $8,200 | $0 | $0 |
| 2021 | $465 | $7,700 | $0 | $0 |
| 2020 | $419 | $6,500 | $0 | $0 |
| 2019 | $641 | $6,200 | $700 | $5,500 |
| 2018 | $550 | $5,983 | $0 | $0 |
| 2017 | $623 | $6,300 | $0 | $0 |
| 2016 | $861 | $6,247 | $0 | $0 |
| 2014 | -- | $6,064 | $0 | $5,391 |
| 2013 | -- | $6,333 | $0 | $0 |
Source: Public Records
Map
Nearby Homes
- 1521 Stanley St
- 1517 Stanley St
- 1531 Gilbert St
- 2500 Salt St
- 2259 King St
- 2236 King St
- 2221 Salt St
- 1652 Stanley St
- 1716 Maple St
- 2201 S Niagara St
- 2300 Jerome St
- 2219 S Michigan Ave
- 1919 Grout St
- 123 Vermont St
- 1918 Stanley St
- 1717 S Hamilton St
- 1817 Ring St
- 1620 King St
- 1823 Ring St
- 1916 Joslin St
- 1533 Stanley St
- 1537 Stanley St
- 1543 Stanley St
- 1522 Gilbert St
- 1530 Gilbert St
- 1513 Stanley St
- 1512 Gilbert St
- 1532 Stanley St
- 1549 Stanley St
- 1509 Stanley St
- 1528 Stanley St
- 1518 Stanley St
- 1538 Gilbert St
- 1514 Stanley St
- 1506 Stanley St
- 1506 Gilbert St
- 1542 Gilbert St
- 1542 Stanley St
- 1553 Stanley St
- 1510 Stanley St