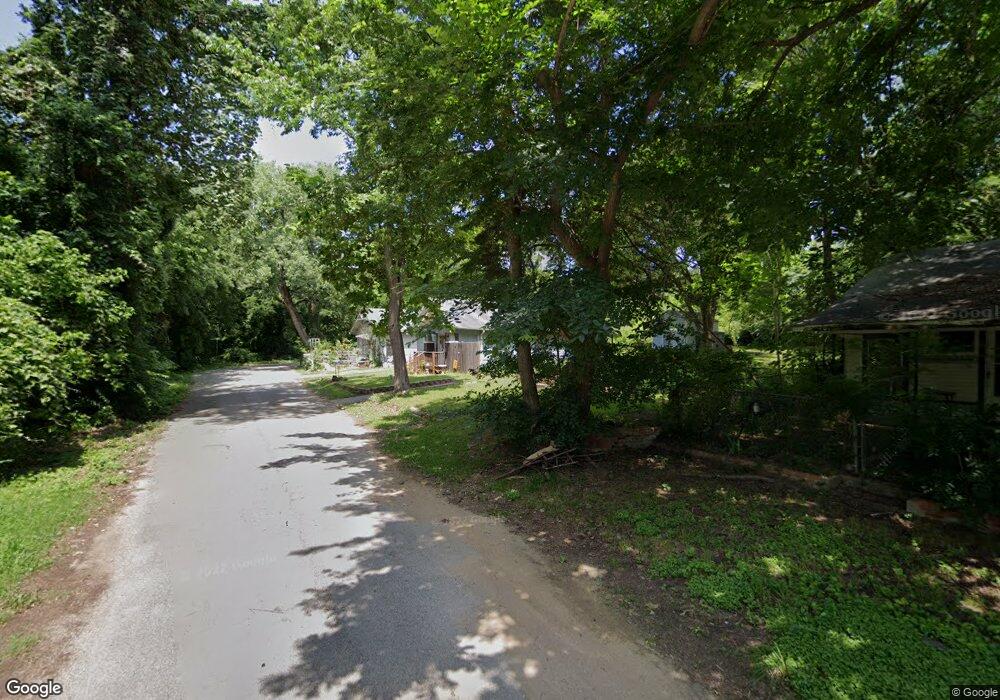
1527 W Owing St Denison, TX 75020
Estimated Value: $130,105 - $162,000
--
Bed
--
Bath
864
Sq Ft
$169/Sq Ft
Est. Value
About This Home
This home is located at 1527 W Owing St, Denison, TX 75020 and is currently estimated at $146,053, approximately $169 per square foot. 1527 W Owing St is a home located in Grayson County with nearby schools including Houston Elementary School, Scott Middle School, and Denison High School.
Ownership History
Date
Name
Owned For
Owner Type
Purchase Details
Closed on
Feb 18, 2004
Sold by
Milstead Bill and Milstead Brenda
Bought by
Rister Charles C
Current Estimated Value
Create a Home Valuation Report for This Property
The Home Valuation Report is an in-depth analysis detailing your home's value as well as a comparison with similar homes in the area
Home Values in the Area
Average Home Value in this Area
Purchase History
| Date | Buyer | Sale Price | Title Company |
|---|---|---|---|
| Rister Charles C | -- | -- |
Source: Public Records
Tax History Compared to Growth
Tax History
| Year | Tax Paid | Tax Assessment Tax Assessment Total Assessment is a certain percentage of the fair market value that is determined by local assessors to be the total taxable value of land and additions on the property. | Land | Improvement |
|---|---|---|---|---|
| 2025 | $619 | $65,639 | -- | -- |
| 2024 | $1,386 | $59,672 | $0 | $0 |
| 2023 | $542 | $54,247 | $0 | $0 |
| 2022 | $1,172 | $49,315 | $0 | $0 |
| 2021 | $1,131 | $60,938 | $25,480 | $35,458 |
| 2020 | $1,075 | $58,026 | $18,330 | $39,696 |
| 2019 | $1,020 | $55,623 | $14,820 | $40,803 |
| 2018 | $934 | $43,365 | $12,610 | $30,755 |
| 2017 | $857 | $31,510 | $5,200 | $26,310 |
| 2016 | $779 | $27,837 | $4,810 | $23,027 |
| 2015 | $397 | $28,299 | $5,720 | $22,579 |
| 2014 | $590 | $29,872 | $5,720 | $24,152 |
Source: Public Records
Map
Nearby Homes
- 1531 W Main St
- 1326 W Crawford St
- 1319 W Morgan St
- 1731 W Crawford St
- 1609 W Woodard St
- 1221 W Crawford St
- 1231 W Main St
- 1223 W Owing St
- 108 N Eddy Ave
- 501 S Eddy Ave
- 1230 W Woodard St
- 1508 W Shepherd St
- 1315 W Gandy St
- 1217 W Nelson St
- 1224 W Nelson St
- 1120 W Owing St
- 1127 W Morgan St
- 1109 W Crawford St
- 1200 W Gandy St
- 1208 W Sears St
- 1531 W Owing St
- 1509 W Owing St
- 1524 W Crawford St
- 1522 W Crawford St
- 1514 W Crawford St
- 1510 W Owing St
- 1500 W Owing St
- 1515 W Crawford St
- 1523 W Crawford St
- 1521 W Crawford St
- 1531 W Crawford St
- 1614 W Crawford St
- 1509 W Crawford St
- 1507 W Crawford St
- 1430 W Crawford St
- 1616 W Crawford St
- 1601 W Crawford St
- 1522 W Chestnut St
- 1516 W Chestnut St
- 1530 W Chestnut St