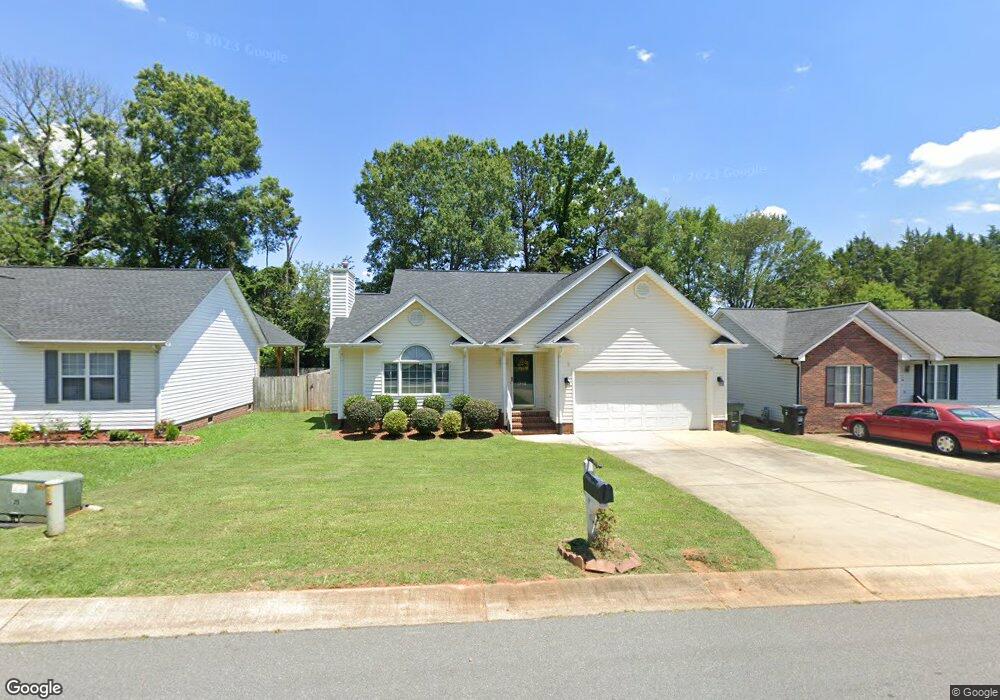
1528 Cambridge Heights Place NW Concord, NC 28027
Estimated Value: $284,000 - $321,000
3
Beds
2
Baths
1,351
Sq Ft
$227/Sq Ft
Est. Value
About This Home
This home is located at 1528 Cambridge Heights Place NW, Concord, NC 28027 and is currently estimated at $306,093, approximately $226 per square foot. 1528 Cambridge Heights Place NW is a home located in Cabarrus County with nearby schools including Charles E. Boger Elementary School, Northwest Cabarrus Middle School, and Northwest Cabarrus High.
Ownership History
Date
Name
Owned For
Owner Type
Purchase Details
Closed on
May 23, 2017
Sold by
Condrey Hartwell E and Condrey Jean C
Bought by
Condrey Stact Faulkner and Condrey Roger F
Current Estimated Value
Home Financials for this Owner
Home Financials are based on the most recent Mortgage that was taken out on this home.
Original Mortgage
$108,000
Outstanding Balance
$89,766
Interest Rate
4.08%
Mortgage Type
Adjustable Rate Mortgage/ARM
Estimated Equity
$216,327
Purchase Details
Closed on
Aug 17, 2001
Sold by
Federal Home Loan Mortgage Corporation
Bought by
Condrey Hartwell E and Condrey Jean C
Home Financials for this Owner
Home Financials are based on the most recent Mortgage that was taken out on this home.
Original Mortgage
$90,000
Interest Rate
7.18%
Purchase Details
Closed on
Oct 6, 2000
Sold by
Cefalo Linda A and Morrison Michelle M
Bought by
Charter One Mtg Corp
Purchase Details
Closed on
Oct 1, 1996
Bought by
Cefalo Linda A
Create a Home Valuation Report for This Property
The Home Valuation Report is an in-depth analysis detailing your home's value as well as a comparison with similar homes in the area
Home Values in the Area
Average Home Value in this Area
Purchase History
| Date | Buyer | Sale Price | Title Company |
|---|---|---|---|
| Condrey Stact Faulkner | $120,000 | None Available | |
| Condrey Hartwell E | -- | -- | |
| Charter One Mtg Corp | $109,286 | -- | |
| Cefalo Linda A | $110,000 | -- |
Source: Public Records
Mortgage History
| Date | Status | Borrower | Loan Amount |
|---|---|---|---|
| Open | Condrey Stact Faulkner | $108,000 | |
| Previous Owner | Condrey Hartwell E | $90,000 |
Source: Public Records
Tax History Compared to Growth
Tax History
| Year | Tax Paid | Tax Assessment Tax Assessment Total Assessment is a certain percentage of the fair market value that is determined by local assessors to be the total taxable value of land and additions on the property. | Land | Improvement |
|---|---|---|---|---|
| 2025 | $2,977 | $298,870 | $54,000 | $244,870 |
| 2024 | $2,977 | $298,870 | $54,000 | $244,870 |
| 2023 | $2,196 | $179,960 | $45,000 | $134,960 |
| 2022 | $2,196 | $179,960 | $45,000 | $134,960 |
| 2021 | $2,196 | $179,960 | $45,000 | $134,960 |
| 2020 | $2,196 | $179,960 | $45,000 | $134,960 |
| 2019 | $1,515 | $124,140 | $20,000 | $104,140 |
| 2018 | $1,490 | $124,140 | $20,000 | $104,140 |
| 2017 | $1,421 | $120,430 | $20,000 | $100,430 |
| 2016 | $843 | $124,410 | $20,000 | $104,410 |
| 2015 | $1,468 | $124,410 | $20,000 | $104,410 |
| 2014 | $1,468 | $124,410 | $20,000 | $104,410 |
Source: Public Records
Map
Nearby Homes
- 1515 Cambridge Heights Place NW
- 1543 Cambridge Heights Place NW
- 1282 Branson Rd NW
- 4188 Deerfield Dr NW
- 1413 Old Rivers Rd
- 3700 Gainesway Ct NW
- 1813 Old Rivers Rd
- 1132 Rustic Ln NW
- 4155 Guilford Ct NW
- 1843 Old Rivers Rd Unit 209
- 3824 Zemosa Ln NW
- 3856 Zemosa Ln NW
- 1253 Falling Acorn Ln
- 3740 Backwater St
- 3911 Zemosa Ln NW
- 2006 Applegate Dr
- 0 Orphanage Rd Unit 4
- 1042 Wexford Place NW
- 4499 Hunton Dale Rd NW
- 1389 Kison Ct NW
- 1524 Cambridge Heights Place NW
- 1532 Cambridge Heights Place NW
- 1520 Cambridge Heights Place NW Unit 32
- 1520 Cambridge Heights Place NW
- 1536 Cambridge Heights Place NW
- 1516 Cambridge Heights Place NW
- 1531 Cambridge Heights Place NW
- 1527 Cambridge Heights Place NW
- 1540 Cambridge Heights Place NW
- 1535 Cambridge Heights Place NW
- 1523 Cambridge Heights Place NW
- 1539 Cambridge Heights Place NW
- 1519 Cambridge Heights Place NW
- 1512 Cambridge Heights Place NW
- 1544 Cambridge Heights Place NW
- 1547 Cambridge Heights Place NW
- 1508 Cambridge Heights Place NW
- 1548 Cambridge Heights Place NW
- 3950 Davidson Hwy
- 1551 Cambridge Heights Place NW