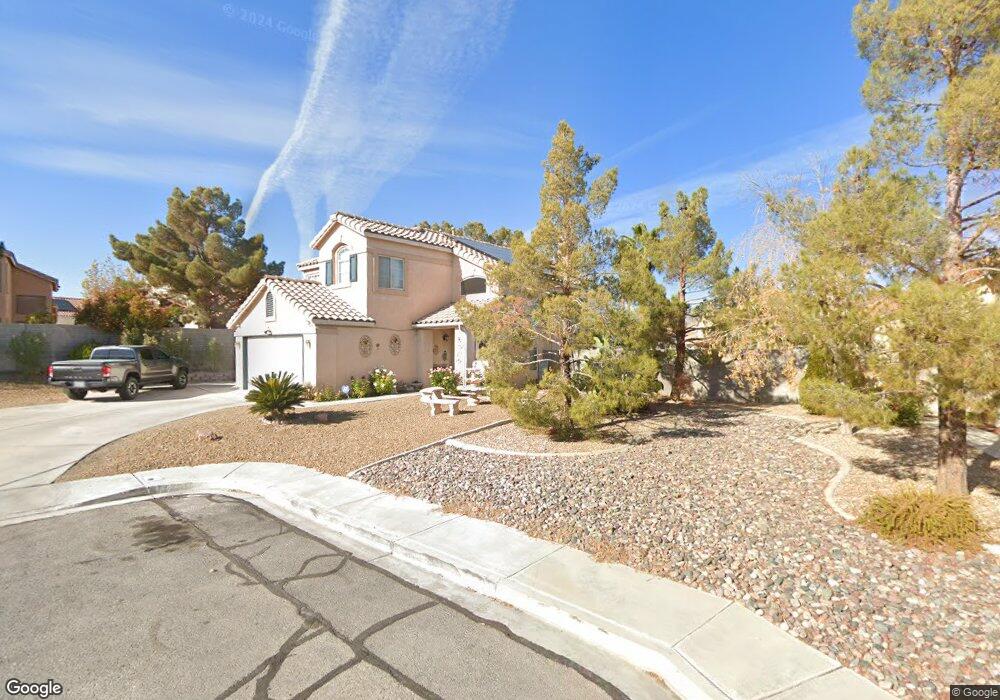
1528 Fort Dix Cir North Las Vegas, NV 89031
Craig Ranch NeighborhoodEstimated Value: $390,000 - $458,000
4
Beds
3
Baths
1,722
Sq Ft
$253/Sq Ft
Est. Value
About This Home
This home is located at 1528 Fort Dix Cir, North Las Vegas, NV 89031 and is currently estimated at $436,332, approximately $253 per square foot. 1528 Fort Dix Cir is a home located in Clark County with nearby schools including Lee Antonello Elementary School, Brian & Teri Cram Middle School, and Legacy High School.
Ownership History
Date
Name
Owned For
Owner Type
Purchase Details
Closed on
Jan 18, 2012
Sold by
Snyder Daniel B
Bought by
Aranda Illarramendi Danailys
Current Estimated Value
Home Financials for this Owner
Home Financials are based on the most recent Mortgage that was taken out on this home.
Original Mortgage
$96,002
Outstanding Balance
$66,660
Interest Rate
4.25%
Mortgage Type
FHA
Estimated Equity
$369,672
Purchase Details
Closed on
Mar 25, 2002
Sold by
Ryerson Kenneth M and Ryerson Kimberly
Bought by
Snyder Daniel B
Home Financials for this Owner
Home Financials are based on the most recent Mortgage that was taken out on this home.
Original Mortgage
$172,380
Interest Rate
6.84%
Mortgage Type
VA
Purchase Details
Closed on
Dec 14, 1993
Sold by
Pardee Construction Company Of Nevada
Bought by
Ryerson Kenneth M and Ryerson Kimberly
Home Financials for this Owner
Home Financials are based on the most recent Mortgage that was taken out on this home.
Original Mortgage
$112,100
Interest Rate
7.1%
Create a Home Valuation Report for This Property
The Home Valuation Report is an in-depth analysis detailing your home's value as well as a comparison with similar homes in the area
Home Values in the Area
Average Home Value in this Area
Purchase History
| Date | Buyer | Sale Price | Title Company |
|---|---|---|---|
| Aranda Illarramendi Danailys | $98,500 | Ticor Title Las Vegas | |
| Snyder Daniel B | $169,000 | Fidelity National Title | |
| Ryerson Kenneth M | $118,500 | National Title Company |
Source: Public Records
Mortgage History
| Date | Status | Borrower | Loan Amount |
|---|---|---|---|
| Open | Aranda Illarramendi Danailys | $96,002 | |
| Previous Owner | Snyder Daniel B | $172,380 | |
| Previous Owner | Ryerson Kenneth M | $112,100 |
Source: Public Records
Tax History Compared to Growth
Tax History
| Year | Tax Paid | Tax Assessment Tax Assessment Total Assessment is a certain percentage of the fair market value that is determined by local assessors to be the total taxable value of land and additions on the property. | Land | Improvement |
|---|---|---|---|---|
| 2025 | $1,620 | $99,525 | $31,500 | $68,025 |
| 2024 | $1,573 | $99,525 | $31,500 | $68,025 |
| 2023 | $1,573 | $93,508 | $29,050 | $64,458 |
| 2022 | $1,674 | $81,858 | $22,400 | $59,458 |
| 2021 | $1,550 | $77,691 | $21,000 | $56,691 |
| 2020 | $1,437 | $77,045 | $20,650 | $56,395 |
| 2019 | $1,346 | $73,604 | $17,850 | $55,754 |
| 2018 | $1,285 | $68,095 | $14,350 | $53,745 |
| 2017 | $2,258 | $67,315 | $12,600 | $54,715 |
| 2016 | $1,204 | $62,497 | $8,750 | $53,747 |
| 2015 | $1,200 | $50,004 | $7,000 | $43,004 |
| 2014 | $1,163 | $33,968 | $7,000 | $26,968 |
Source: Public Records
Map
Nearby Homes
- 1515 Fort Dix Cir
- 6056 Fort Wayne Ct
- 5871 Prairie Ridge Cir
- 1611 Spotted Pony Dr
- 1415 Black Hills Way
- 6126 Leaning Rock Ct
- 1323 Borderwood Ln
- 5904 Arrowleaf St
- 5823 Rose Sage St
- 6241 Golden Rain St
- 6236 Badgerglen Place
- 1642 Heather Ridge Rd
- 1901 Desert Sage Ave
- 5912 Hollowridge Rd
- 1903 Ginger Blossom Ave
- 6136 Benchmark Way
- 5655 Indian Springs St
- 1003 Dover Glen Dr
- 6219 Disruptor St Unit 3
- 1910 Night Shadow Ave
- 1524 Fort Dix Cir
- 6046 Canyon Gap Dr
- 6050 Canyon Gap Dr
- 6050 Canyon Gap Dr Unit n/a
- 6042 Canyon Gap Dr
- 6059 Hidden Rock Dr
- 6054 Canyon Gap Dr
- 1520 Fort Dix Cir
- 6038 Canyon Gap Dr
- 1531 Fort Dix Cir
- 6063 Hidden Rock Dr
- 6058 Canyon Gap Dr
- 1527 Fort Dix Cir
- 6034 Canyon Gap Dr
- 1523 Fort Dix Cir
- 6067 Hidden Rock Dr
- 6030 Canyon Gap Dr
- 6062 Canyon Gap Dr
- 1601 Golden Glen Ct
- 1519 Fort Dix Cir