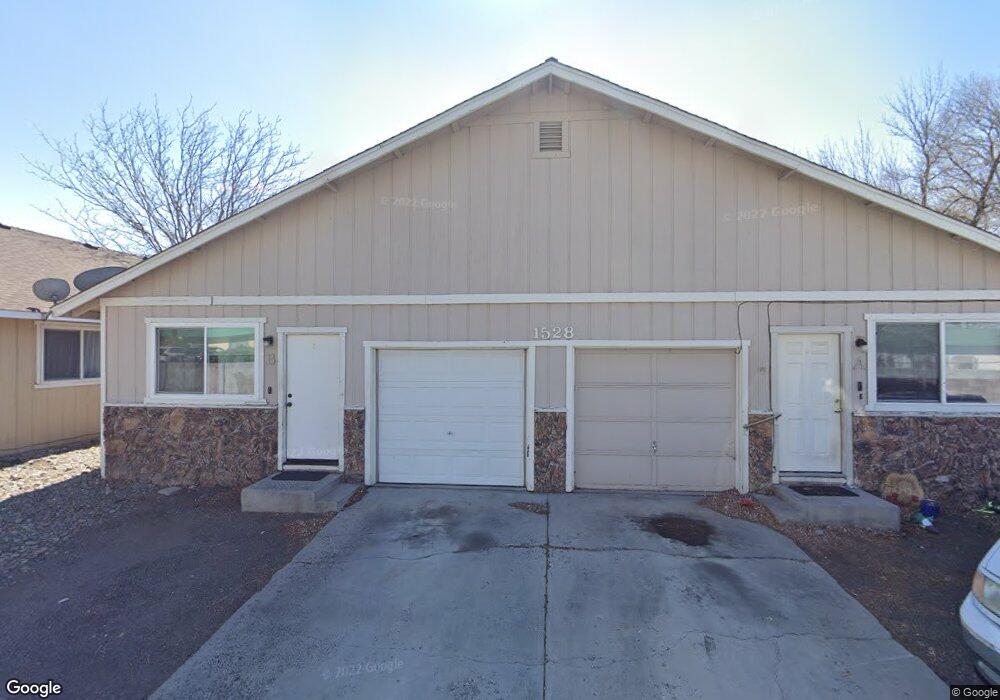
1528 North Ct Unit B Gardnerville, NV 89410
Estimated Value: $447,095 - $467,000
2
Beds
1
Bath
1,300
Sq Ft
$353/Sq Ft
Est. Value
About This Home
This home is located at 1528 North Ct Unit B, Gardnerville, NV 89410 and is currently estimated at $458,774, approximately $352 per square foot. 1528 North Ct Unit B is a home located in Douglas County with nearby schools including Gardnerville Elementary School, Carson Valley Middle School, and Douglas County High School.
Ownership History
Date
Name
Owned For
Owner Type
Purchase Details
Closed on
Dec 20, 2017
Sold by
Tisea Raul and Tisea Janna
Bought by
Mobedda Llc
Current Estimated Value
Purchase Details
Closed on
Jun 28, 2017
Sold by
Tisea Raul and Tisea Janna M
Bought by
Tisea Raul
Purchase Details
Closed on
Sep 2, 2014
Sold by
Alford Ronnie J
Bought by
Alford Ronnie J
Purchase Details
Closed on
Jun 2, 2014
Sold by
Alford Ronnie J
Bought by
Tisea Raul and Tisea Janna M
Home Financials for this Owner
Home Financials are based on the most recent Mortgage that was taken out on this home.
Original Mortgage
$122,219
Interest Rate
4.1%
Mortgage Type
New Conventional
Create a Home Valuation Report for This Property
The Home Valuation Report is an in-depth analysis detailing your home's value as well as a comparison with similar homes in the area
Home Values in the Area
Average Home Value in this Area
Purchase History
| Date | Buyer | Sale Price | Title Company |
|---|---|---|---|
| Mobedda Llc | -- | None Available | |
| Tisea Raul | -- | None Available | |
| Alford Ronnie J | -- | Western Title Co | |
| Tisea Raul | $165,000 | Western Title Co |
Source: Public Records
Mortgage History
| Date | Status | Borrower | Loan Amount |
|---|---|---|---|
| Previous Owner | Tisea Raul | $122,219 |
Source: Public Records
Tax History Compared to Growth
Tax History
| Year | Tax Paid | Tax Assessment Tax Assessment Total Assessment is a certain percentage of the fair market value that is determined by local assessors to be the total taxable value of land and additions on the property. | Land | Improvement |
|---|---|---|---|---|
| 2025 | $2,081 | $56,964 | $31,500 | $25,464 |
| 2024 | $2,081 | $58,561 | $31,500 | $27,061 |
| 2023 | $1,927 | $55,837 | $31,500 | $24,337 |
| 2022 | $1,784 | $52,397 | $28,000 | $24,397 |
| 2021 | $1,652 | $48,346 | $24,500 | $23,846 |
| 2020 | $1,598 | $48,551 | $24,500 | $24,051 |
| 2019 | $1,542 | $45,283 | $21,000 | $24,283 |
| 2018 | $1,472 | $41,245 | $17,500 | $23,745 |
| 2017 | $1,412 | $41,703 | $17,500 | $24,203 |
| 2016 | $1,376 | $37,661 | $12,250 | $25,411 |
| 2015 | $1,374 | $37,661 | $12,250 | $25,411 |
| 2014 | $1,331 | $36,369 | $12,250 | $24,119 |
Source: Public Records
Map
Nearby Homes
- 1522 North Ct
- 1517 Mill Creek Way
- 1494 Hussman Ave
- 1480 Garden Glen Ct
- 1468 Garden Glen Ct
- 1471 U S Highway 395 N Unit 2
- 1219 Heybourne Rd
- 1420 Douglas Ave Unit 11
- 1420 Douglas Ave Unit 4
- Residence Four Plan at Kingsbury Estates
- Residence One Plan at Kingsbury Estates
- Residence Two Plan at Kingsbury Estates
- Residence Three Plan at Kingsbury Estates
- 1202 Spur Way
- 1205 Spur Way
- 1249 Concho Trail Unit 2
- 1248 Cinch Trail Unit 3
- 1254 Concho Trail Unit 1
- 469 Blackbird Ln Unit Lot 22
- 1391 Centerville Ln
- 1528 North Ct
- 1526 North Ct Unit A and B
- 1526 North Ct
- 1526 North Ct Unit A/B
- 1526 North Ct Unit 2
- 1530 North Ct
- 1527 Douglas Ave Unit A & B
- 1527 Douglas Ave
- 1525 Douglas Ave
- 1525 Douglas Ave Unit B
- 1529 Douglas Ave
- 1529 Douglas Ave Unit A & B
- 1524 North Ct
- 1523 Douglas Ave Unit A & B
- 1523 Douglas Ave
- 1528 Us Highway 395 N
- 1528 Us Highway 395 N Unit 235
- 1528 Us Highway 395 N Unit 235
- 1528 Us Highway 395 N Unit 245
- 1528 U S Highway 395 N Unit 200