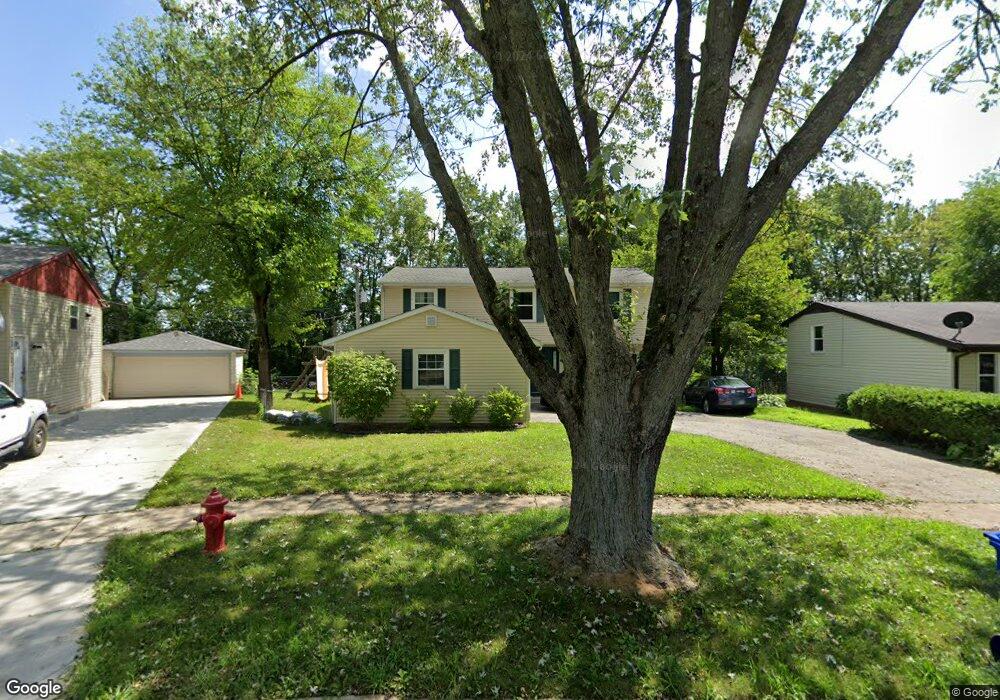
1528 Plymouth Cir Carpentersville, IL 60110
Estimated Value: $278,000 - $301,552
3
Beds
2
Baths
1,680
Sq Ft
$173/Sq Ft
Est. Value
About This Home
This home is located at 1528 Plymouth Cir, Carpentersville, IL 60110 and is currently estimated at $291,388, approximately $173 per square foot. 1528 Plymouth Cir is a home located in Kane County with nearby schools including Golfview Elementary School, Carpentersville Middle School, and Dundee-Crown High School.
Ownership History
Date
Name
Owned For
Owner Type
Purchase Details
Closed on
Aug 13, 2009
Sold by
Habitat For Humanity Of Northern Fox Val
Bought by
Green Robert W and Green Jennifer A
Current Estimated Value
Home Financials for this Owner
Home Financials are based on the most recent Mortgage that was taken out on this home.
Original Mortgage
$131,099
Interest Rate
5.19%
Mortgage Type
Seller Take Back
Purchase Details
Closed on
Jun 2, 2009
Sold by
Heredia Jose E
Bought by
Habitat For Humanity Of Northern Fox Val
Purchase Details
Closed on
Jun 14, 2002
Sold by
Hud
Bought by
Heredia Jose E
Home Financials for this Owner
Home Financials are based on the most recent Mortgage that was taken out on this home.
Original Mortgage
$74,500
Interest Rate
8.7%
Purchase Details
Closed on
Oct 10, 2001
Sold by
Wosar Alois and Wosar Maria A
Bought by
Hud
Create a Home Valuation Report for This Property
The Home Valuation Report is an in-depth analysis detailing your home's value as well as a comparison with similar homes in the area
Home Values in the Area
Average Home Value in this Area
Purchase History
| Date | Buyer | Sale Price | Title Company |
|---|---|---|---|
| Green Robert W | -- | Chicago Title Insurance Co | |
| Habitat For Humanity Of Northern Fox Val | $75,000 | National Title Center Inc | |
| Heredia Jose E | -- | Stewart Title Company | |
| Hud | -- | -- |
Source: Public Records
Mortgage History
| Date | Status | Borrower | Loan Amount |
|---|---|---|---|
| Previous Owner | Green Robert W | $131,099 | |
| Previous Owner | Heredia Jose E | $74,500 | |
| Closed | Heredia Jose E | $70,030 |
Source: Public Records
Tax History Compared to Growth
Tax History
| Year | Tax Paid | Tax Assessment Tax Assessment Total Assessment is a certain percentage of the fair market value that is determined by local assessors to be the total taxable value of land and additions on the property. | Land | Improvement |
|---|---|---|---|---|
| 2024 | $6,028 | $87,595 | $12,553 | $75,042 |
| 2023 | $5,950 | $78,815 | $11,295 | $67,520 |
| 2022 | $5,754 | $72,081 | $11,295 | $60,786 |
| 2021 | $5,622 | $68,059 | $10,665 | $57,394 |
| 2020 | $5,529 | $66,529 | $10,425 | $56,104 |
| 2019 | $5,408 | $63,157 | $9,897 | $53,260 |
| 2018 | $4,666 | $53,019 | $9,701 | $43,318 |
| 2017 | $4,472 | $49,597 | $9,075 | $40,522 |
| 2016 | $4,863 | $50,206 | $8,787 | $41,419 |
| 2015 | -- | $38,627 | $8,234 | $30,393 |
| 2014 | -- | $31,716 | $8,007 | $23,709 |
| 2013 | -- | $32,687 | $8,252 | $24,435 |
Source: Public Records
Map
Nearby Homes
- 1423 Windsor Cir
- 1505 Plymouth Cir
- 1000 Adams Ct
- 901 Garfield Dr
- 25 Rolling Hills Dr
- 2021 Berkshire Cir Unit B
- 51 Golfview Ln
- 512 Tyler Dr
- 160J Bateman Rd
- 7 Hickory Dr
- 34 Hickory Dr
- 57 Robin Rd
- 225 Westfield Way
- 1105 Denver Dr
- 1415 Plainview Rd
- 827 Balmoral Dr
- 730 Council Hill Rd
- 4 Austin Ave
- 7 Austin Ave
- Lot 6B Ravine Rd
- 1526 Plymouth Cir
- 1530 Plymouth Cir
- 1524 Plymouth Cir
- 1532 Plymouth Cir
- 1531 Plymouth Cir
- 1519 Plymouth Cir
- 1517 Plymouth Cir
- 1534 Plymouth Cir
- 1535 Plymouth Cir
- 1522 Plymouth Cir
- 1515 Plymouth Cir
- 1536 Plymouth Cir
- 1520 Plymouth Cir
- 1518 Plymouth Cir
- 1537 Plymouth Cir
- 1516 Plymouth Cir
- 1513 Plymouth Cir
- 1538 Plymouth Cir
- 1514 Plymouth Cir
- 1616 Marlboro Cir