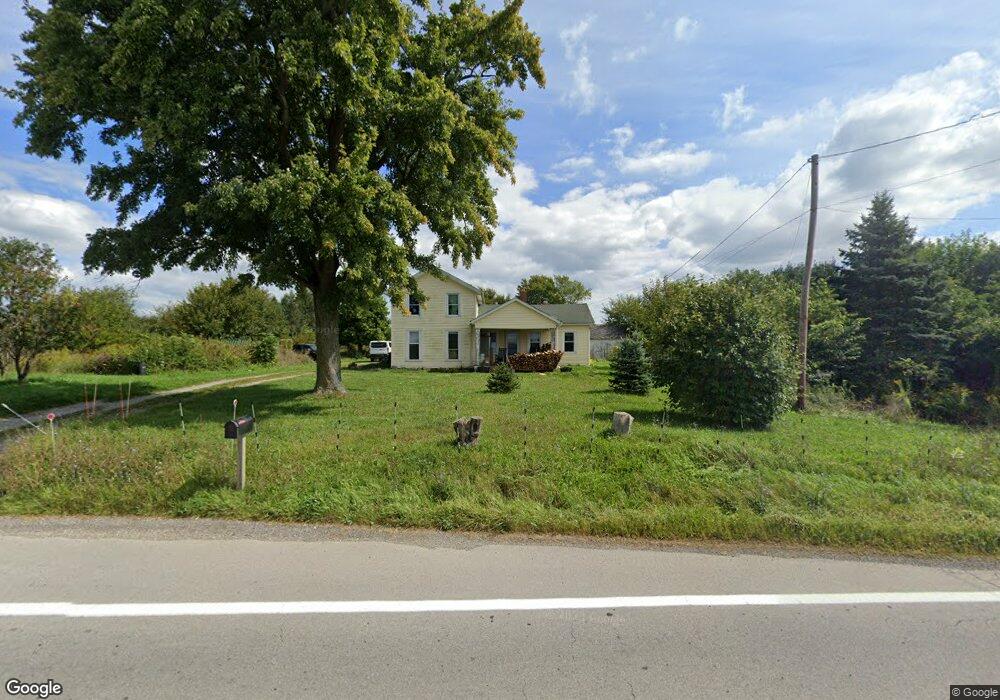
1528 State Route 60 S New London, OH 44851
Estimated Value: $152,388 - $223,000
2
Beds
1
Bath
2,167
Sq Ft
$84/Sq Ft
Est. Value
About This Home
This home is located at 1528 State Route 60 S, New London, OH 44851 and is currently estimated at $181,097, approximately $83 per square foot. 1528 State Route 60 S is a home located in Huron County with nearby schools including New London Elementary School, New London Middle School, and New London High School.
Ownership History
Date
Name
Owned For
Owner Type
Purchase Details
Closed on
Jul 9, 2021
Sold by
Switalski Brian D and Switalski Rebecca C
Bought by
Brownell Brent J and Brownell Gretchen D
Current Estimated Value
Purchase Details
Closed on
Apr 30, 2012
Bought by
Swita Brian D and Swita Rebecca C
Purchase Details
Closed on
Nov 22, 2002
Sold by
Est Archie B Cook
Bought by
Lodi Countrytyme
Home Financials for this Owner
Home Financials are based on the most recent Mortgage that was taken out on this home.
Original Mortgage
$523,000
Interest Rate
6.08%
Mortgage Type
New Conventional
Purchase Details
Closed on
Apr 5, 1999
Sold by
Morgan Nancy
Bought by
Doddroe John and Doddroe Sharon
Purchase Details
Closed on
May 27, 1998
Bought by
Morgan Nancy D
Purchase Details
Closed on
Aug 25, 1997
Sold by
Morgan Nancy D
Bought by
Cook Archie B
Purchase Details
Closed on
Apr 29, 1997
Bought by
Morgan Nancy
Purchase Details
Closed on
Apr 20, 1973
Bought by
Morgan Ray D
Create a Home Valuation Report for This Property
The Home Valuation Report is an in-depth analysis detailing your home's value as well as a comparison with similar homes in the area
Home Values in the Area
Average Home Value in this Area
Purchase History
| Date | Buyer | Sale Price | Title Company |
|---|---|---|---|
| Brownell Brent J | $101,000 | Chicago Title | |
| Swita Brian D | $101,000 | -- | |
| Lodi Countrytyme | $510,000 | -- | |
| Doddroe John | $91,000 | -- | |
| Morgan Nancy D | -- | -- | |
| Cook Archie B | $14,500 | -- | |
| Morgan Nancy | -- | -- | |
| Morgan Ray D | -- | -- |
Source: Public Records
Mortgage History
| Date | Status | Borrower | Loan Amount |
|---|---|---|---|
| Closed | Lodi Countrytyme | $523,000 |
Source: Public Records
Tax History Compared to Growth
Tax History
| Year | Tax Paid | Tax Assessment Tax Assessment Total Assessment is a certain percentage of the fair market value that is determined by local assessors to be the total taxable value of land and additions on the property. | Land | Improvement |
|---|---|---|---|---|
| 2024 | $1,492 | $41,350 | $12,400 | $28,950 |
| 2023 | $1,421 | $39,030 | $9,320 | $29,710 |
| 2022 | $1,373 | $39,030 | $9,320 | $29,710 |
| 2021 | $1,373 | $39,030 | $9,320 | $29,710 |
| 2020 | $1,470 | $39,030 | $9,320 | $29,710 |
| 2019 | $1,667 | $44,370 | $9,320 | $35,050 |
| 2018 | $1,634 | $44,370 | $9,320 | $35,050 |
| 2017 | $1,206 | $35,390 | $8,490 | $26,900 |
| 2016 | $1,191 | $35,390 | $8,490 | $26,900 |
| 2015 | $1,185 | $35,410 | $8,500 | $26,910 |
| 2014 | $1,147 | $33,470 | $8,510 | $24,960 |
| 2013 | $1,143 | $33,470 | $8,510 | $24,960 |
Source: Public Records
Map
Nearby Homes
- 21 Cedar St
- 152 N Main St Unit 2
- 41 N Railroad St
- 41 Walnut St
- 115 W Main St
- 0 Section Line Rd Unit 20253852
- 179 W Main St
- 155 E Main St
- 159 E Main St
- 34 Park Ave
- 99 S Main St
- 201 E Main St
- 109 Clifton St
- 128 1st St
- 113 3rd St
- 1345 County Road 16
- 37 State Route 60
- 3969 Town Line Road 187
- 816 Butler Rd S
- 141 State Route 60
- 1528 Ohio 60
- 421 Ohio 60
- 0 Ledgett & Biglow Pkwy
- 0 Ledgett & Biglow Pkwy
- 1430 Ohio 60
- 1457 State Route 60 S
- 1431 State Route 60 S
- 1400 State Route 60 S
- 1413 State Route 60 S
- 2 Charles Pkwy
- 2261 Townline Road 79 S
- 1396 State Route 60 S
- 206 N Main St
- 15 E Fir St
- 1381 State Route 60 S
- 188 N Main St
- 27 E Fir St
- 27 E Fir St
- 35 E Fir St
- 1363 State Route 60 S